Key Laboratory of Haikou Trauma, Key Laboratory of Hainan Trauma and Disaster Rescue, Key Laboratory of Emergency and Trauma, Ministry of Education, The First Affiliated Hospital of Hainan Medical University, Hainan Medical University, Haikou 571199, China
b
Engineering Research Center for Hainan Bio-Smart Materials and Bio-Medical Devices, College of Emergency and Trauma, Hainan Medical University, Haikou 571199, China
c
Department of Breast Surgery, The First Affiliated Hospital of Hainan Medical University, Haikou 570102, China
Received 10 September 2024, Revised 5 November 2024, Accepted 24 November 2024, Available online 26 November 2024, Version of Record 29 November 2024.Full Text
•Glutathione-Activated Near-infrared II Fluorescent Probe (LJ-GSH) was developed.
•The probe LJ-GSH showed high specificity and suitable response sensitivity for the detection of GSH in vitro.
•LJ-GSH enables dynamic visualization of the biological role of GSH within the physiological environment.
•Precise lung metastasis imaging and fluorescence-guided tumor resection have been achieved using LJ-GSH.
Abstract
Accurate identification of intraoperative tumor lesions and effective treatment are crucial for improving surgical outcomes. Near-infrared (NIR) fluorescence imaging demonstrates advantages over traditional medical approaches in tumor interventions, garnering significant attention. However, clinically available imaging agents are generally limited by their “always on” characteristics, which can lead to non-specific imaging interference and “false-positive” results. In this context, we present a glutathione-activated NIR-II probe, LJ-GSH, designed for metastatic tumor imaging and specific imaging-guided tumor resection. LJ-GSH initially exhibits quenched fluorescence due to the weak electron-donating effect of the thiophenol moiety, which is recovered at 815/910 nm upon activation by the overexpressed levels of glutathione (GSH) in tumor cells and tissues, significantly enhancing the specificity of tumor imaging. This unique characteristic positions LJ-GSH as a reliable fluorescent sensor for monitoring GSH dynamics during physiological events. Notably, the probe’s NIR-II emission feature markedly improves imaging contrast and resolution, facilitating real-time identification and imaging of lung metastatic lesions. With the aid of high-specific NIR-II imaging guidance, tumor tissues can be precisely resected, with the residual negative margin diameter reduced to approximately 0.2 mm. We envision that our tailored probe may offer an attractive option for clinical applications.
Malignancies, characterized by the uncontrolled growth of cancer cells and a high risk of metastasis, present a significant threat to human life and health [1], [2], [3]. Precisely monitoring the dynamic changes in tumors allows for early diagnosis and on-site evaluation of tumor development and progression, thereby enabling personalized therapy and enhancing patient survival rates [4], [5], [6]. In recent years, clinical imaging modalities such as CT, PET, and MRI have witnessed significant advances in tumor detection and localization. However, highly sensitive preoperative and intraoperative diagnosis of tumor remains a challenge for the above imaging modalities, primarily due to their limited resolution, potential radiation exposure risks, and inability to offer timely feedback on treatment outcomes during surgery [7], [8]. As an alternative tracer technology, fluorescence imaging poses significant superiority over the above medical imaging approaches in tumor interventions, benefiting from its high sensitivity, non-invasive, and fast feedback, thus, having attracted widely interesting [9], [10], [11], [12].
Recently, efforts have focused on designing and developing fluorescent-based agents for disease diagnosis and treatment. Compared to conventional imaging probes in the visible region, fluorescence imaging in the NIR-II region (1000–1700 nm) exhibits deeper tissue penetration and higher spatiotemporal resolution due to reduced tissue autofluorescence and photon scatter, enhancing accuracy and reliability in disease detection [13], [14], [15], [16], [17], [18]. Clinically approved NIR fluorescent contrast agents, such as indocyanine green (ICG) and methylene blue (MB), have been utilized for tumor detection and guiding tumor treatment [19], [20]. However, these imaging probes typically face the challenge of short tumor retention and quick clearance from the body. Additionally, many of the currently available clinical agents display the “always on” characteristic, where they illuminate disease sites through self-accumulation rather than being specifically activated by target molecules of interest, which leads to poor imaging contrast and compromised detection accuracy. To address the issue mentioned above, stimulus-responsive fluorescence imaging strategies that can activate signal light-up only in the presence of biomarkers or pathological environments can afford higher tumor-to-normal tissue ratios (T/N ratio) and real-time biological information, making the activatable modality a preferred choice for disease diagnosis and therapy evaluation [21], [22], [23], [24], [25].
To develop the activation-responsive system for tumor imaging, it is crucial to carefully select a biomarker that is associated with the tumor. Studies have shown that the rapid angiogenesis, proliferation, and metastasis of tumors are linked to the overexpression of reactive oxygen species (ROS) [26], [27]. To circumvent the tumor-related oxidative stress, Glutathione (GPx4) and NADPH act synergistically to maintain a cellular redox homeostasis environment via the generation of endogenous antioxidants, represented by the reduced state of glutathione (GSH). Elevated levels of GSH are commonly found in many types of tumors, and have been considered as the key indicator for discrimination of tumor region from the normal tissue [28], [29], [30], [31], [32]. Moreover, mitochondria are gaining increasing attention due to their critical role as the hub of metabolic activity and their potential as targets for cancer treatment. Consequently, the development of mitochondria-targeted fluorescent probes has emerged as a significant focus of research. To date, several GSH-activatable fluorescent molecular probes have been developed for detecting endogenous GSH and for further exploration of its biological role [33], [34], [35], [36], [37], [38]. Despite significant advancements in GSH sensors designed for in vivo tumor imaging and therapy intervention, challenges remain. These challenges are partly due to the limited emission wavelength (less than 700 nm), undesirable mitochondrial targeting capabilities and the inadequate sensitivity of these sensors in detecting endogenous GSH levels, which typically range within the millimolar concentration.
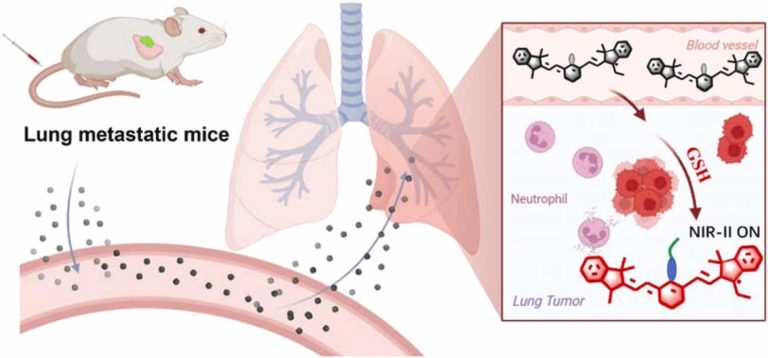
To address earlier issues mentioned, herein, we report the GSH-activatable NIR-I/II fluorescent probe for specific tumor detection and image-guided tumor resection (Scheme 1). In this study, a carboxy-modified heptamethine cyanine (Cy-7) derivative was chosen as the fluorescence reporter due to its excellent biocompatibility and intrinsic ability to target mitochondria [39], [40], [41]. Additionally, p-Methoxy thiophenol functionality was integrated into the Cy-7 fluorophore to serve as a GSH-specific response site and fluorescence quencher, resulting in the fabrication of the NIR fluorescent sensor LJ-GSH. Initially, LJ-GSH exhibits a weak fluorescence signal due to the fluorescence quencher effect of the thiophenol site. However, upon exposure to a solution containing GSH, the GSH reacts with the probe through aromatic nucleophilic substitution, leading to the formation of a thiol skeleton with enhanced electron transfer and the subsequent emission of the bright optical signal. In vitro studies have shown that LJ-GSH demonstrates a suitable response sensitivity (0−10 mM GSH) and high specificity for GSH, with an emission maximum at 815/910 nm. This unique characteristic makes LJ-GSH a reliable fluorescent tool for discriminating tumor cells from normal ones based on GSH content discrepancy. Additionally, distinct fluctuations in GSH levels during the oxygen-glucose deprivation model process were monitored with real-time fluorescence imaging. More importantly, in combination with its NIR-II emission and GSH-specific activation characteristics, the probe LJ-GSH demonstrated promising capabilities for the precise localization of subcutaneous tumors and lung metastatic lesions, achieving the accurate removal of tumors with negative margins as small as 0.2 mm in diameter.
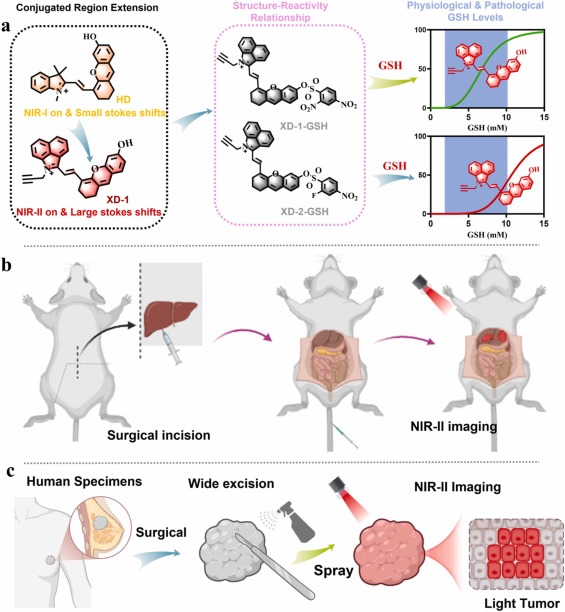
Scheme 1. (a) Schematic illustration of probe LJ-GSH design and response strategy. (b) Schematic describing the mechanism of utilizing LJ-GSH for NIR-II imaging-guided lung metastatic lesions diagnosis.
Design and synthesis of GSH-responsive NIR-II probe LJ-GSH
Developing a fluorescent diagnostic probe for tumor applications, the ideal imaging agent should meet the following prerequisites: (1): NIR fluorescence emission for deep-tissue penetration and minimize auto-fluorescence; (2) tumor-related biomarker activation to enhance tumor imaging contrast (3): a highly specific response to the biomarker for increasing the accuracy in tumor diagnostics. To this end, we selected Cy derivative as the fluorescent scaffold considering its NIR emits characteristic, easy modification and favorable biocompatibility. Then, p-Methoxy-modified thiophenol, as the GSH reaction site and a fluorescence quencher, was incorporated into Cy skeleton to prepare probe LJ-GSH. The synthesis of the probe followed the route shown in Scheme S1, and the compound was characterized using nuclear magnetic resonance (1H/13C NMR) and high-resolution mass spectrometry (ESI-HRMS)
Fig. 1. (a) Absorption spectra of LJ-GSH (10 μM) upon the addition of 0–10 mM GSH; (b) NIR-I, and (c) NIR-II FL spectrum of LJ-GSH (10 μM) after treatment with different concentrations of GSH (0–10 mM). (d) Titration curve of LJ-GSH (10 μM) to 0–10 mM GSH; (e) Linear relationship between fluorescence intensity at 815 nm and [GSH] in the range of 0.25–2.0 mM; (f) NIR-I FL response of 10 μM LJ-GSH to various interfering species and GSH. λex = 808 nm for NIR-II, and λex = 720 nm for NIR-I.
Fig. 2. (a-i) Cells were only incubated with probe (10 μM) for 30 min. (a-ii) Cells were pre-treated with 1 mM NEM for 20 min, and then cells were incubated with LJ-GSH for 30 min. (a-iii) Cells were treated with GSH-ethyl-ester (1 mM) and probe (10 μM) for 30 min. Cells were pre-incubated with H2O2 (0.2 mM, a-vi), 5 μg/mL Lps (a-v), and 2.5 μg/mL Lps (a-vi) for 2 h, and then incubated with LJ-GSH (10 μM) for 30 min. (b) Fluorescence intensity of Aa−f group cells. Data denote mean±s.d. (n=3, **P<0.01, ***P<0.001, ****P<0.0001). The images were recorded with 633 nm excitation and 725−800 nm collection. Scale bars: 25 μm.
Fig. 3. (ai-iv) Time-dependent (0–90 min) real-time GSH imaging with LJ-GSH (10 μM) in 4T1 cells under oxygen-glucose deprivation (glucose-free (0 mM: 0 G), 1 % O2). (a-v-a-viii) After 90 min oxygen-glucose deprivation, cells were incubated with normal medium containing (25 mM glucose) and 21 % O2 for different reperfusion time, 30 min (a-v), 60 min (a-vi), 90 min (a-vii), 120 min (a-viii), subsequent, LJ-GSH (10 μM) were added to cells for another 30 min incubation. (b) Fluorescence intensity of ai−aviii group cells. Data denote mean±s.d. The images were recorded with 633 nm excitation and 725−800 nm collection. Scale bars: 25 μm.
Fig. 4. (a-i) Time-dependent in vivo fluorescence imaging of GSH in tumor bearing mice at NIR-I window and (a-ii) at NIR-II window. (b) NIR-I and (d) NIR-II Fluorescence intensity in tumor region at various time points (0–24 h) after i.v. injection of LJ-GSH (100 μL, 1 mM). (c) T/N ratios after 24 h i.v. injection of probes at NIR-I window, and (e) at NIR-II window. (f) Time-dependent T/N ratios after i.v. injection of probes. (g)-(h) representative ex vivo fluorescence images of tumor and major organs at 24 h post-injection of LJ-GSH. (i) Normalized NIR-II fluorescence intensity of the tumor and other organs in panels g. (j) NIR-II image-guided subcutaneous tumor resection. (k) SBR of the resected tumor (ROI-A) and post-surgery position (ROI-B). (l) Line profile of photon counts from j. (m)-(n) H&E staining results of excised tumor margin, Scar bar: 200 μm. (o) Kaplan–Meier survival rate curve of five mice with or without tumor resection. NIR-I window: Ex = 745 nm, Em: 780−825 nm. NIR-II images were collected under 808 nm excitation, 900 nm long-pass filter, 40 mW/cm2, and exposure time: 20 ms. n=3, Data denote mean±s.d. (n=3, **P<0.01, ***P<0.001, ****P<0.0001).
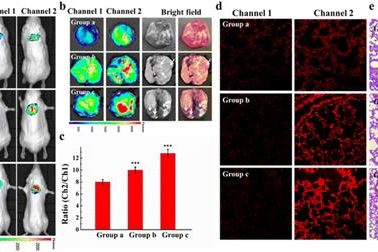
Fig. 5. (a) Schematic illustration the timeline of lung metastasis model establishment and real-time tumor imaging. (b) Representative bioluminescence image. (c)-(d) NIR-II imaging of lung tissue dissected from lung metastatic mice after 24 h post-injection of (100 nM) LJ-GSH. (e) SBR of lung metastatic tumors according to c and d (marked as a-f and control as g). (f) H&E, ki 67, and F4/80 immunofluorescence staining of the resected lung metastatic nodules (ROI-a) Scar bar: 1 mm.
4. Conclusion
In summary, based on cyanine fluorophore, we reported the GSH-activated NIR-I/II fluorescent probe, LJ-GSH, for specific lung metastasis imaging and fluorescence-guided surgical navigations. The probe initially exhibits fluorescence quenching due to the inhibited electron transfer process from p-Methoxy thiophenol functionality to cyanine moiety. Upon interaction with GSH, LJ-GSH converts to its thiol form through GSH-mediate nucleophilic substitution, releasing NIR-I/II emission (815/910 nm) with recovery of electron transfer. In vitro analysis tests have shown probe displays high specificity and suitable sensitivity to GSH, making LJ-GSH a promising tool for imaging GSH dynamics in cells. Benefiting from the high resolution and high-specific NIR-II fluorescence imaging from LJ-GSH, subcutaneous and metastasis breast lesions are clearly distinguished from surrounding normal tissue, with negative margins as small as 0.25 mm in diameter. We expected that LJ-GSH could offer a valuable approach for exploring the biological functions of GSH and potentially serve as a therapeutic technology for GSH-related tumours.
完整作者信息:Kun Dou*†[a], Jiao Lu†[a], Yanlong Xing[a], Rui Wang[a], Miae Won[b],[c],[d], Jungryun Kim[b], Fabiao Yu*[a] and Jong Seung Kim*[b],[c]
Key Laboratory of Haikou Trauma, Key Laboratory of Hainan Trauma and Disaster Rescue, Key Laboratory of Emergency and Trauma, Ministry of Education, The First Affiliated Hospital of Hainan Medical University Hainan Medical University, Haikou 571199, China
海南医科大学于法标教授团队在Chin Chem Lett期刊上发表学术论文,题目为:A near-infrared two-photon fluorescent probe for the detection of HClO in inflammatory and tumor-bearing mice,DOI: 10.1016/j.cclet.2024.110531.
A near-infrared two-photon fluorescent probe for the detection of HClO in inflammatory and tumor-bearing mice
a
Key Laboratory of Emergency and Trauma, Ministry of Education, Key Laboratory of Haikou Trauma, Key Laboratory of Hainan Trauma and Disaster Rescue, The First Affiliated Hospital of Hainan Medical University, Hainan Medical University, Haikou 571199, China
b
Department of Joint Surgery, HongHui Hospital, Xi’an Jiaotong University, Xi’an 710054, China
c
Department of Comprehensive plastic surgery, Plastic Surgery Hospital, Chinese Academy of Medical Sciences and Peking Union Medical College, Beijing, 100144, China
d
Engineering Research Center for Hainan Bio-Smart Materials and Bio-Medical Devices, Key Laboratory of Hainan Functional Materials and Molecular Imaging, College of Emergency and Trauma, College of Pharmacy, Hainan Medical University, Haikou 571199, China
Received 26 August 2024, Revised 30 September 2024, Accepted 8 October 2024, Available online 10 October 2024.
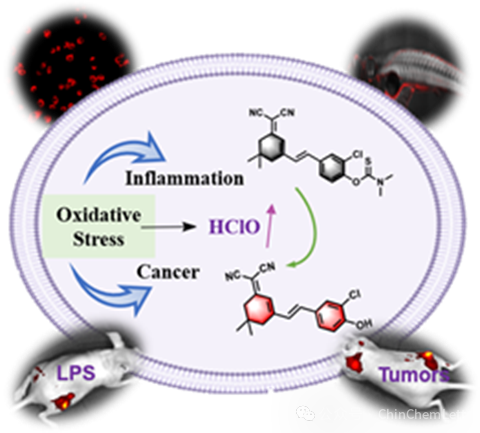
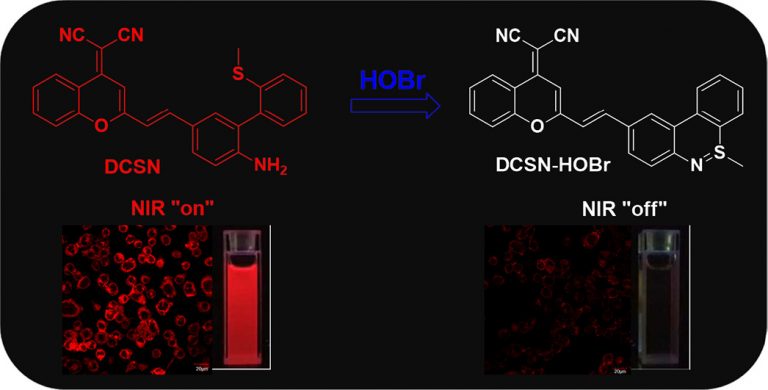
Hypochlorous acid (HClO) is a critical biomolecule in living organisms, playing an essential role in numerous physiological or pathological processes. Abnormal levels of HClO in the body may lead to a series of diseases, for instance, inflammation and cancer. Thus, accurate measurement of HClO levels should be more beneficial for understanding its role in diseases and gaining a deeper insight into the pathogenesis of diseases. In this work, we designed a near-infrared two-photon fluorescent probe (HDM-Cl-HClO) for detecting fluctuations in HClO levels in inflammatory and tumor-bearing mice. Notably, the probe can respond to HClO within 5 s and trigger a brilliant red fluorescence at 660 nm. It exhibits high specificity and sensitivity for HClO. The superior spectral capability of the probe has enabled the detection of HClO levels in cells and zebrafish, as well as achieved the detection of HClO in inflammatory and tumor mice. This work not only provides a novel strategy and tool for HClO imaging in living systems, but also holds great potential for the diagnosis of inflammation and cancer.
Graphical abstract
We have developed a near-infrared two-photon fluorescent probe for the rapid detection of HClO. The probe successfully achieved the tracking of HClO in cells, zebrafish, and mouse model groups of inflammation and tumor, which is expected to be a reliable tool for detecting HClO levels in various disease models.
Dual-Response Functionalized Mitochondrial Fluorescent Probe for a Double Whammy Monitoring of Hypochlorite and Sulfur Dioxide in Heat Shock via Time Scales
Click to copy article link
Hongshuai Cao Feifei Yu Kun Dou Rui Wang Yanlong Xing Xianzhu Luo* Fabiao Yu*
【文献详情】 Hongshuai Cao, Feifei Yu, Kun Dou, Rui Wang, Yanlong Xing, Xianzhu Luo, and Fabiao Yu. Dual-Response Functionalized Mitochondrial Fluorescent Probe for a Double Whammy Monitoring of Hypochlorite and Sulfur Dioxide in Heat Shock via Time Scales. Anal. Chem.2024, https://doi.org/10.1021/acs.analchem.4c05488
Abstract
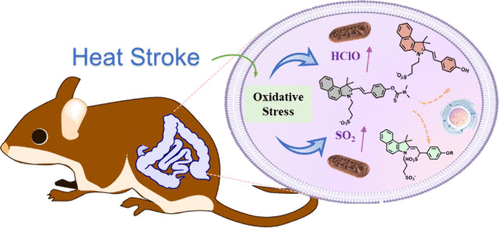
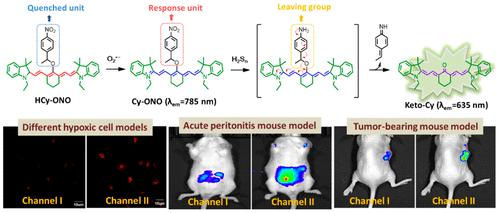
Heat shock seriously affects the normal functioning of an organism and can lead to damage and even death in severe cases. To prevent or treat heat shock-related diseases, we require a better understanding of the mechanism of thermocytotoxicity. Here, we designed a functionalized dual-response fluorescent probe (HCy-SO2-HClO) that could individually or simultaneously detect hypochlorous acid (HClO) and sulfur dioxide (SO2) without interfering with each other and achieved the simultaneous tracing of both during the heat shock process for the first time. The introduction of the sulfonate group greatly increased the water solubility of the probe. Furthermore, the probe could effectively accumulate in the mitochondrial region. HCy-SO2-HClO could respond to HClO and SO2 within 10 s and 20 min, respectively, realizing a double whammy detection of both on the time scale. HCy-SO2-HClO exhibited high specificity and sensitivity for HClO and SO2. The highly biocompatible probe HCy-SO2-HClO successfully achieved the detection of endogenous and exogenous SO2 and HClO in living cells and in zebrafish. Moreover, the simultaneous detection of HClO and SO2 in heat shock cells and mouse intestines was realized for the first time. This probe has achieved the detection of dual markers, which enhanced the accuracy and precision of disease detection and could serve as an effective research tool to prevent heat stroke-related diseases.
Heat shock is an imbalance in thermoregulation caused by exposure to high temperatures, which in turn causes dysfunction of the central nervous and circulatory systems. (1,2) Moreover, if heat shock is not treated in a timely manner, it may cause convulsions, kidney damage, or even death. (3−5) Although there are heat shock proteins in the body, individuals with low immunity or certain genetic diseases are prone to heat stroke, which can have a mortality rate of approximately 40%. (6) Therefore, understanding the pathogenesis of heat shock is critical. Currently, some reports demonstrate that mitochondrial dysfunction is induced when a person is exposed to high temperatures, leading to the disruption of intracellular redox homeostasis. (7,8) Despite the severe impact of heat shock on health, research on its specific pathogenesis is relatively scarce, especially in terms of mitochondrial dysfunction and the disruption of intracellular redox homeostasis.
Hypochlorous acid (HClO), as a key intracellular active substance, participates in intracellular signal transduction and affects the growth, differentiation, and reproduction of cells. (9−11) In addition, it is also an important component of the body’s immune system, providing an effective defense against bacteria and viruses. (12−14) However, an imbalance of intracellular HClO may trigger a series of diseases, such as inflammatory, neurological, cardiovascular, and cancer. (15−17) Several recent reports exhibit that HClO is strongly associated with heat stroke (an inflammation-associated disease), (18,19) so investigating the important role that HClO plays in the balance of cellular redox homeostasis may help to understand heat shock diseases in greater depth. In contrast, sulfur dioxide (SO2), an indispensable intracellular antioxidant, assumes a crucial function in maintaining cellular homeostasis, preserving vasodilation, regulating cardiovascular disease, and combating blood pressure. (20−22) However, abnormal SO2 not only may cause respiratory illnesses, for instance, bronchitis and chronic obstructive pulmonary disease, but also may lead to organ damage. (23,24) Therefore, the real-time measurement of SO2 in organisms is helpful in understanding its physiological role. Although some research has correlated SO2 or HClO with heat shock diseases, (19,25,26) simultaneous studies of both in heat shock diseases have not been reported. Therefore, we hope to further explore the link between intracellular redox homeostasis and heat shock through the fluctuation of intracellular HClO and SO2 levels in order to better prevent or treat heat shock diseases.
Currently, numerous methods for detecting HClO and SO2 have been developed, such as chromatography, colorimetry, and electrochemistry, among others. (27−30) Although these methods are able to accurately determine changes in HClO and SO2 levels, they are not well-suited for real-time detection in biological systems due to their lengthy preprocessing or analysis requirements and the potential for damaging biological tissues. Fluorescence imaging technology, with its high sensitivity, high resolution, and capability for noninvasive real-time detection of specific substances within biological systems, has gained widespread popularity. (31−34) Nowadays, fluorescence imaging technology is widely applied in biomedicine, disease diagnosis, surgical navigation, and environmental science. (35,36) Compared with single-response fluorescent probes, multiresponse fluorescent probes can obtain more effective information and avoid false-positive signals, thus improving the accuracy of detection and revealing the role of relevant substances in diseases, which is significant in promoting the use of fluorescent probes in biomedical fields. (37−39) Recently, several reviews have summarized the trends in dual-response probes. (40−42) Also, fluorescent probes for the dual response of HClO and SO2 have been developed. (43−45) However, most of the probes are not capable of detection both individually and simultaneously without interference.
Here, we proposed a mitochondria-targeted dual-responsive fluorescent probe (HCy-SO2-HClO) aimed at visualizing intracellular HClO and SO2. The probe was capable of efficiently and simultaneously monitoring HClO and SO2 through two different fluorescence channels across various time scales, effectively avoiding the problem of inaccurate detection of one substance due to the consumption of the probe by another substance. HCy-SO2-HClO exhibited high sensitivity and specificity for these two substances while also possessing excellent biocompatibility. Furthermore, we further delved into the interrelationship between intracellular redox homeostasis and the heat shock response via monitoring the dynamic changes of HClO and SO2. Notably, we successfully achieved the dual monitoring of HClO and SO2 for the first time in heat shock-treated cells and mouse models, suggesting that these two substances could serve as key biomarkers for heat shock. This finding not only provided important clues for insights into the biological mechanisms of heat shock but also offered a scientific basis and potential therapeutic strategies to prevent or treat heat shock-related diseases.
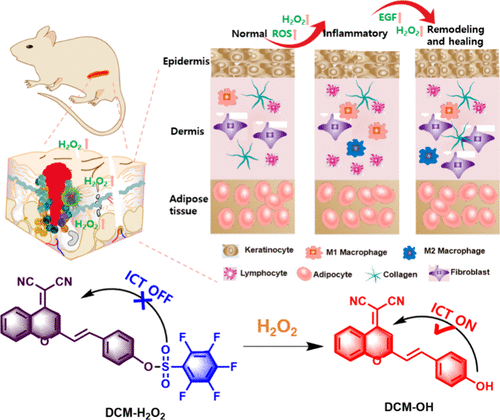
A simple hydrogen peroxide-activatable Bodipy for tumor imaging and type I/II photodynamic therapy
Fangqing Ge, ‡aYujie Sun,‡bYu Wang,bDan Yu,bZhijia Wang【王智佳】, *abFabiao Yu【于法标】, *cBingran Yu *b and Hongbing Fu a
Beijing Key Laboratory for Optical Materials and Photonic Devices, Department of Chemistry, Capital Normal University, Beijing 100048, P. R. China
Laboratory of Biomedical Materials and Key Lab of Biomedical Materials of Natural Macromolecules, Beijing University of Chemical Technology, Beijing 100029, P. R. China
Key Laboratory of Emergency and Trauma, Ministry of Education, Key Laboratory of Haikou Trauma, Key Laboratory of Hainan Trauma and Disaster Rescue, Engineering Research Centre for Hainan Bio-Smart Materials and Bio-Medical Devices, Key Laboratory of Hainan Functional Materials and Molecular Imaging, The First Affiliated Hospital of Hainan Medical University, Hainan Medical University, Haikou 571199, China Txet Full
Abstract
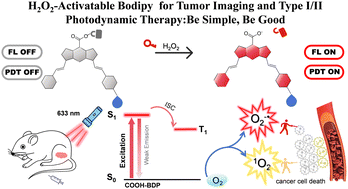
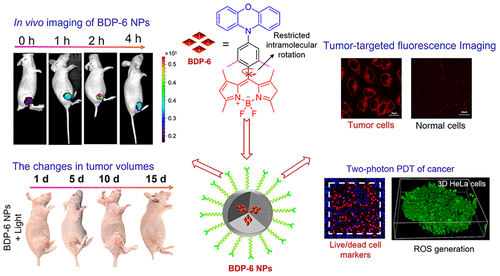
Tumor microenvironment-activatable photosensitizers have gained significant attention for cancer theranostics. Considering the hypoxic environment of solid tumors, activatable phototheranostic agents with type I PDT are desired to obtain improved cancer treatment efficiency. Herein, we report a simple, effective and multifunctional Bodipy photosensitizer for tumor imaging and type I/II photodynamic therapy. The photosensitizer featuring a methylphenylboronic acid pinacol ester group at the meso-position of Bodipy specifically responds to tumor-abundant H2O2. Its photophysical properties were characterized using steady-state and time-resolved transient optical spectroscopies. The fluorescence (ΦF = 0.09%) and singlet oxygen efficacy (ΦΔ = 10.2%) of the Bodipy units were suppressed in the caged dyads but significantly enhanced (ΦF = 0.72%, ΦΔ = 20.3%) upon H2O2 activation. Fluorescence emission spectroscopy and continuous wave electron paramagnetic resonance (EPR) spectroscopy confirmed that the Bodipy photosensitizer generates reactive oxygen species (ROS) via both electron transfer-mediated type I and energy transfer-mediated type II mechanisms. In vitro experiments demonstrated rapid internalization into tumor cells, enhanced brightness stimulated by tumor microenvironments, and tumor cell death (phototoxicity, IC50 = 0.5 μM). In vivo fluorescence imaging indicated preferential accumulation of this Bodipy photosensitizer in tumor sites, followed by decaging by tumor-abundant H2O2, further elevating the signal-to-background ratio (SBR) of imaging. Besides outstanding performance in tumor imaging, a prominent inhibition of tumor growth was observed. Given its simple molecular skeleton, this Bodipy photosensitizer is a competitive candidate for cancer theranostics.
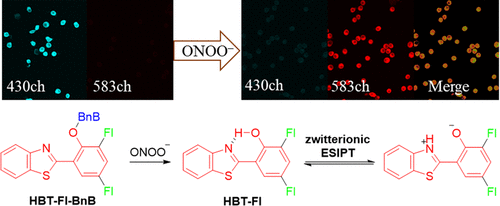
Discovery of peroxynitrite elevation in zinc ion-induced acute lung injury with an activatable near-infrared fluorogenic probe
a
Key Laboratory of Emergency and Trauma of Ministry of Education, Department of Radiotherapy, The First Affiliated Hospital of Hainan Medical University, Hainan Medical University, Haikou 571199, China
b
Key Laboratory of Hainan Trauma and Disaster Rescue, Key Laboratory of Haikou Trauma, Engineering Research Center for Hainan Bio-Smart Materials and Bio-Medical Devices, College of Emergency and Trauma, Hainan Medical University, Haikou 571199, China
Received 10 July 2024, Revised 10 October 2024, Accepted 20 October 2024, Available online 21 October 2024, Version of Record 24 October 2024Full Text
•An ultrafast near-infrared fluorogenic probe DCI-BT was designed for the detection of ONOO-.
•Employing DCI-BT, Zn2+-induced endogenous ONOO- production in cells was successfully visualized for the first time.
•DCI-BT was successfully applied to monitor the changes in ONOO- levels in the Zn2+-induced ALI model.
•Sulforaphane was shown to be effective in protecting mice with Zn2+-induced ALI.
Abstract
Particulate matter derived from environmental pollution might contain zinc ions (Zn2+), and inhaling these particles exacerbates lung tissue’s inflammatory response, impairing lung function and increasing the risk of acute lung injury (ALI). Zn2+ is known to contribute to oxidative stress, leading to elevated levels of reactive oxygen species such as peroxynitrite (ONOO-), which play a key role in the pathogenesis of ALI. Herein, a novel near-infrared fluorogenic probe, DCI-BT, was prepared for the specific detection of ONOO- based on the strategy of oxidative hydrolysis of imine to break into aldehyde. The response of DCI-BT to ONOO- was found to be extremely fast, and the addition of ONOO- would enhance its fluorescence intensity. Cell experiments showed that DCI-BT could efficiently indicate the changes in cellular ONOO- levels. Furthermore, employing DCI-BT, the Zn2+-induced endogenous ONOO- production in cells was successfully visualized, confirming that prolonged exposure to Zn2+ triggered cellular oxidative stress. Finally, the application of DCI-BT in the mice model of ALI was evaluated, and the results revealed that it had good biosafety and could effectively track the changes in ONOO- levels in the Zn2+-induced ALI model. Therefore, DCI-BT held promise as a valuable chemical tool for diagnosing and treating environmentally induced oxidative stress-related diseases.
Graphical Abstract
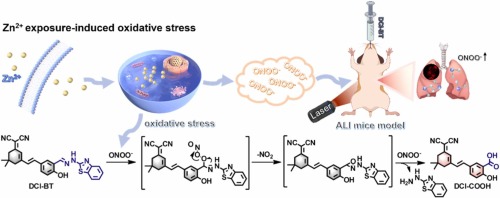
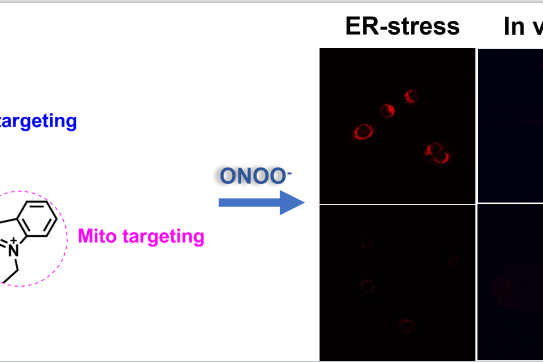
An innovative NIRF probe DCI-BT was capable of monitoring ONOO- in vitro and in vivo. In Zn2+-exposed ALI mice models, DCI-BT enabled real-time imaging of ONOO- levels and found that the degree of Zn2+-induced lung injury was positively correlated with the level of ONOO-.
1. Introduction
With rapid industrialization, environmental pollution has become a significant factor endangering human health. Zinc ions (Zn2+), as a typical metal ion in the environment, originate from industrial emissions, mining, waste disposal, and other pathways. Particulate matter suspended in the atmosphere (e.g., PM2.5) may adsorb Zn2+ on its surface and enter the lungs via the respiratory tract [1], [2]. It is well known that zinc is a widely distributed and essential trace element, critical for maintaining normal physiological functions in living organisms [3]. The transport of Zn2+ in cells mainly depends on the transmembrane zinc channel proteins solute-related carrier (SLC) 39 A and SLC30A [4], [5]. However, high concentrations of Zn2+ may induce oxidative stress through multiple signaling mechanisms, resulting in potential toxicity. Imbalances in zinc homeostasis are correlated with the development of various diseases, including diabetes, alcoholic liver disease, lung injury, and traumatic brain injury [6], [7], [8]. Previous studies have shown that environmental Zn2+ concentrations are closely associated with acute lung injury (ALI), e.g., exposure to high-dose Zn2+ up-regulates the expression levels of pro-inflammatory factors (e.g. IL-8 and COX-2) in human respiratory epithelial cells [9], [10], [11].
Peroxynitrite (ONOO-), as a common reactive oxygen species (ROS) in living organisms, is produced through the diffusion reaction of nitric oxide and superoxide anion [12]. ONOO- can undergo oxidative or nitrative reactions with a variety of biomolecules (proteins, DNA, and lipids), and participates in cellular signaling processes by modulating its structure and function, which ultimately leads to the occurrence of diseases, such as neurodegenerative, inflammatory, and cancerous diseases [13], [14], [15]. It has been found that prolonged exposure to high-dose Zn2+ triggers oxidative stress, apoptosis or necrosis, and damage to respiratory and lung tissues [16], [17]. Meanwhile, ONOO- generated in the inflammatory response will further participate in the oxidative stress process and exacerbate oxidative cell damage [18]. Therefore, clarifying the complex relationship between Zn2+ exposure and ONOO- helps to understand the mechanism of oxidative stress in Zn2+-induced ALI, which is of great significance for environmental protection and timely intervention in ALI.
With high spatial and temporal resolution, fluorescence imaging enables tracking the dynamic changes of target molecules in organisms in real-time, providing more accurate results for disease diagnosis [19]. Compared with UV-vis fluorescent probes, near-infrared fluorogenic (NIRF) probes have higher tissue penetration ability, lower photodamage, and background fluorescence, making them a promising tool for studying the physiological distribution and concentration changes of reactive species [20], [21], [22], [23], [24], [25]. Harnessing various chemical reaction strategies, including N-dearylation [26], [27], [28], [29], oxidative cleavage of hydrazine [30], boronic acids/boronic esters oxidation [31], [32], [33], and oxidative breaking of unsaturated bonds [34], [35], several fluorescent probes for the detection of ONOO- have been constructed [36], [37], [38], [39], [40]. However, despite the existing ONOO- fluorogenic probes being used in different disease models, no reports of NIRF probes have been applied to investigate Zn2+ exposure-induced changes in ONOO- levels (Table S1). Moreover, current studies have paid less attention to environmentally induced ALI, which differs significantly from modeling pathogen-induced ALI. Therefore, exploring the impact of Zn2+ exposure on ONOO- levels is of great significance for understanding environmentally induced ALI. In this work, a novel NIRF probe, namely DCI-BT, for ONOO-, was designed and synthesized. The first positive correlation between the elevated ONOO- and the degree of lung injury was demonstrated in Zn2+-induced cell and ALI mice models (Scheme 1).
Scheme 1. Schematic illustration of DCI-BT for specific detection of ONOO- in Zn2+ exposure-induced ALI (by Figdraw).
Fig. 1. (a) Emission spectra of DCI-BT (10 μM) upon the addition of different concentrations of ONOO- (0–14 μM). (b) Fluorescence responses of DCI-BT (10 μM) at 640 nm after adding varied concentrations of ONOO- (0–28 μM). (c) The linear relationship between fluorescence intensities of DCI-BT at 640 nm and ONOO- concentrations ranging from 0 to 14 μM. (d) Fluorescence intensities change of DCI-BT (10 μM) at 640 nm in the absence or presence of ONOO- (14 μM) as a function of time. (e) pH effect on fluorescence intensities of DCI-BT at 640 nm before and after the addition of ONOO- (14 μM). (f) Selectivity studies of DCI-BT (10 μM) with various biological interfering analytes (100 μM): 1. blank, 2. ONOO-, 3. K+, 4. Ca2+, 5. Mg2+, 6. Zn2+, 7. Cu2+, 8. CO32-, 9. NO3-, 10. SO42-, 11. HSO3-, 12. HS-, 13. Cys, 14. GSH, 15. 1O2, 16. O2.-, 17. .OH, 18. H2O2, 19. -OCl. Data are expressed as the mean ± SD (n = 3).
Fig. 2. Visualization of exogenous ONOO- with DCI-BT (λex = 488 nm). (a) First row: HPMEC cells preincubated with SIN-1 (0, 50, 100 μM), SIN-1 (100 μM) + AG (1 mM) for 30 min were stained with DCI-BT (10 μM) for 30 min. Second row: RAW264.7 cells preincubated with SIN-1 (0, 50, 100 μM), SIN-1 (100 μM) + AG (1 mM) for 30 min were stained with DCI-BT (10 μM) for 30 min. Scale bar: 50 μm. (b) The pixel intensity of DCI-BT labeled HPMEC cells. (c) The pixel intensity of DCI-BT labeled RAW264.7 cells. Data are expressed as the mean ± SD (n = 3).
Fig. 3. Time course fluorescence images of RAW264.7 cells under ZnSO4 exposure. Blue channel: the cells were stained with Hoechst 33258 (5 μg/mL) for 30 min (λex = 405 nm). From the first to the fifth column, the cells stimulated with ZnSO4 (100 μM) for 0, 15, 30, 60, and 90 min were incubated with DCI-BT (10 μM) for 30 min. Sixth column: the cells pretreated with ZnSO4 (100 μM) and AG (1 mM) for 90 min were incubated with DCI-BT (10 μM) for 30 min. Merge channel: the images overlap with blue and red channels. Scale bar: 50 μm.
Fig. 4. Confocal images of RAW264.7 cells under ZnSO4 stress. (a) Blue channel: the cells were stained with Hoechst 33258 (5 μg/mL) for 30 min; red channel: the cells were stimulated with various concentrations of ZnSO4 (0, 50, 100, 200 μM), ZnSO4 (200 μM) + ebselen (200 μM) for 90 min, then stained with DCI-BT (10 μM) for 30 min; merge channel: the images were the overlap of blue and red channels. Scale bar: 50 μm. (b) The pixel intensity of DCI-BT labeled RAW264.7 cells in the red channel in (a). (c) The protein levels of iNOS, IL-6, IN-1β, and TNF-α were detected by western blot analysis. (d) The relative protein expression level of iNOS, IL-6, IN-1β, and TNF-α shown in (c). Data are expressed as the mean ± SD (n = 3).
Fig. 5. (a) NIRF fluorescence imaging of control and various Zn2+ concentrations exposure mice after intratracheal drip injection of DCI-BT (200 μM, 40 μL) for 30 min. λex/em = 535/650 nm. (b) Photographs and fluorescence imaging of dissected major organs (heart, liver, spleen, lung, kidney) from mice in plane (a). (c) H&E staining of lung tissue in Zn2+ exposure-induced ALI model. Sections of lung tissue were immunostained with an antibody that detected 3-NT. (d) Quantification of average FL intensities in plane (a). (e) Lung wet/dry ratio in control and Zn2+ exposure mice. (f) Proportion of 3-NT positive area in control and Zn2+ exposure mice. Bars represented mean ± S.D. (n = 3). Statistical analysis was performed using a one-way ANOVA and multiple comparison test of significant differences (*P<0.05, **P <0.01, ***P <0.001).
Fig. 6. (a) NIRF fluorescence imaging of control and high-dose Zn2+ exposure mice at different times after intratracheal drip injection of DCI-BT (200 μM, 40 μL) for 30 min. λex/em = 535/650 nm. (b) Photographs and fluorescence imaging of dissected major organs (heart, liver, spleen, lung, kidney) from mice in plane (a). (c) Quantification of average FL intensities in plane (a). (d-f) Serum levels of inflammatory factors IL-6, IL-1β, and TNF-α in control and Zn2+ exposure mice. (g) Different concentrations of Zn2+ exposure induced the protein levels of COX-2, IL-6, and IL-1β in mice lung tissues. Statistical analysis was performed using a one-way ANOVA and multiple comparison test of significant differences (*P<0.05, **P <0.01, ***P <0.001, ****P <0.0001).
Conclusion
In conclusion, a novel NIRF probe DCI-BT for ONOO- was successfully designed and synthesized through the condensation and dehydration reaction of DCI-CHO with 2-hydrazinobenzothiazole. The fluorescence of DCI-BT was dramatically enhanced upon the oxidative cleavage of imine moiety by ONOO-, which mainly originated from the release of fluorophore DCI-COOH. The highly sensitive nature of DCI-BT, with its near-infrared fluorescence capabilities, allowed for real-time, non-invasive imaging of ONOO-. One of the most promising clinical applications of DCI-BT was in the early diagnosis of ALI, particularly in patients exposed to environmental pollutants like Zn2+. ONOO- in lung tissues could serve as a biomarker for oxidative stress-induced lung injury. In the Zn2+-induced cell model, the level of ONOO- was significantly up-regulated, and DCI-BT allowed dynamic visual monitoring of this process. We found that Zn2+-exposed mice induced ALI. Leveraging DCI-BT, we confirmed that i) the degree of lung injury in mice treated with high-dose Zn2+ was significantly higher than that in mice treated with low-dose Zn2+, ii) the degree of Zn2+-induced lung injury was positively correlated with the level of ONOO-, and iii) SFN had a protective effect against ALI induced by Zn2+ exposure. These findings illustrated the importance of DCI-BT as a promising chemical tool in the study of the occurrence and development of Zn2+-induced ALI.
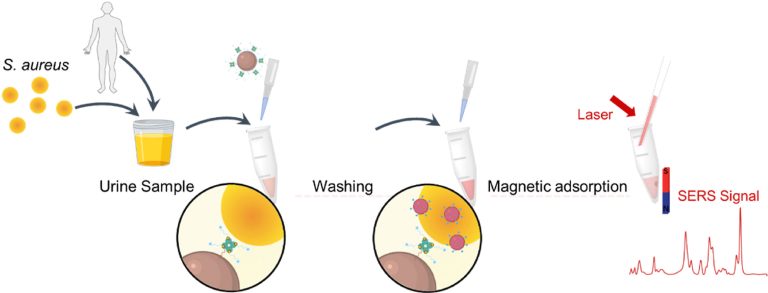
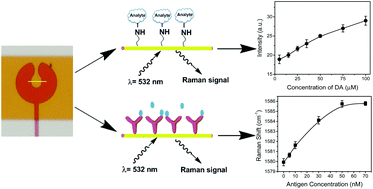
Highly sensitive SERS nanoplatform based on aptamer and vancomycin for detection of S. aureus and its clinical application
a
Key Laboratory of Hainan Trauma and Disaster Rescue, The First Affiliated Hospital of Hainan Medical University, Hainan Medical University, Haikou, 571199, China
b
Engineering Research Center for Hainan Bio-Smart Materials and Bio-Medical Devices, Key Laboratory of Emergency and Trauma, Ministry of Education, Key Laboratory of Hainan Functional Materials and Molecular Imaging, College of Emergency and Trauma, Hainan Medical University, Haikou, 571199, China
c
School of Pharmacy, Hainan Medical University, Haikou, 571199, China
d
Jiangyin Center for Disease Control and Prevention, No. 158 Changjiang Road, Jiangyin, 214431, China
Received 11 April 2024, Revised 30 July 2024, Accepted 7 August 2024, Available online 8 August 2024, Version of Record 15 August 2024.Full Text
Rational design of an activatable dual-color fluorogenic probe for revealing the interaction of adenosine-5′-triphosphate and peroxynitrite in pyroptosis associated with acute kidney injury
,,,,,,,,,
a
Key Laboratory of Emergency and Trauma of Ministry of Education, Department of Otolaryngology, Head and Neck Surgery, The First Affiliated Hospital of Hainan Medical University, Hainan Medical University, Haikou 571199, China
b
Shengli Clinical Medical College of Fujian Medical University, Department of Otolaryngology, Head and Neck Surgery, Fujian Provincial Hospital, Fuzhou 350001, China
c
Key Laboratory of Hainan Trauma and Disaster Rescue, Engineering Research Center for Hainan Bio-Smart Materials and Bio-Medical Devices, College of Emergency and Trauma, Hainan Medical University, Haikou 571199, China
Received 11 April 2024, Revised 17 June 2024, Accepted 24 July 2024, Available online 25 July 2024, Version of Record 26 July 2024.Full Text
Highlights
•An ideal NIRF probe P2 with dual-color fluorescence emission harnessed for the simultaneous detection of ATP and ONOO-.
•An interrelationship between ATP and ONOO- during pyroptosis was verified.
•P2 was successfully applied to monitor ATP and ONOO- levels in the AKI mice model.
Abstract
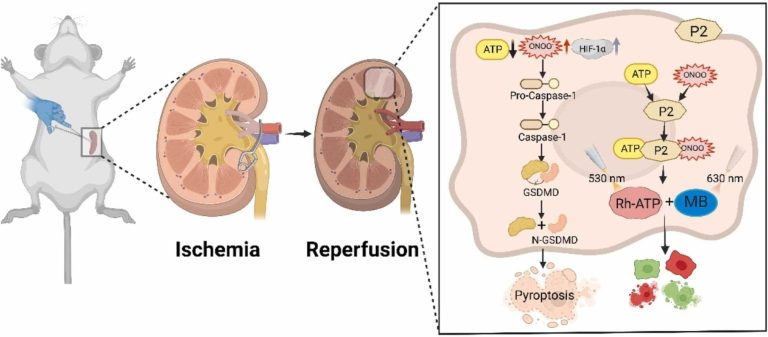
ATP and ONOO- play unique roles in various biological events and exhibit notable interactions. To date, there is no available chemical tool for investigating the correlation between ATP and ONOO- concentrations in pyroptosis associated with acute kidney injury (AKI). Herein, we designed a novel dual-color near-infrared fluorescent (NIRF) probe P2 for simultaneous visualization of ATP and ONOO- both in vitro and in vivo. Unlike previously reported single-site fluorescent probes, P2 enabled concurrent imaging of ATP and ONOO- in two distinct fluorescence channels, with emission wavelengths centered at 585 and 690 nm, which greatly reduced spectral cross-talk. Employing a HK-2 pyroptosis model, a significant interaction between ATP and ONOO- was unveiled. Elevated ONOO- production was found to correlate with decreased ATP levels; conversely, an increase in ATP levels was associated with rapid ONOO- scavenging. Remarkably, P2 allowed the assessment of cellular hypoxia by monitoring ATP and ONOO- concentrations. The commercial ONOO–scavenger uric acid showcased a protective effect on HK-2 cells via inhibition of the cellular pyroptosis pathway. Furthermore, P2 was successfully employed for imaging of ATP and ONOO- in the AKI mice model. Our findings confirmed that renal ischemia-reperfusion triggered a rise in ONOO- levels, concurrent with a decline in ATP levels. Surprisingly, the cells exhibited a compensatory recovery of ATP levels as the reperfusion time was prolonged. These results suggested the newly devised P2, as a pivotal chemical tool for the simultaneous monitoring of ATP and ONOO-, might open new avenues for disease diagnosis and treatment.
Graphical Abstract
Introduction
Adenosine-5′-triphosphate (ATP), primarily synthesized through cellular respiration, stands as a vital energy source for organisms. Disruption of ATP homeostasis is closely related to oxidative stress, which arises from the production of reactive oxygen species (ROS) [1], [2], [3]. Notably, peroxynitrite (ONOO-), an important ROS, is produced in response to stressful inflammation in vivo, further exacerbating the inflammatory response and causing cellular and tissue damage [4], [5]. In recent years, the emergence of pyroptosis, a novel form of programmed cell death observed in inflammatory cells, has attracted considerable attention. Often referred to as cellular inflammatory necrosis, pyroptosis triggers the activation of multiple caspases through inflammatory vesicles, leading to the cleavage of gasdermin family members, including GSDMD, culminating in cell death [6], [7]. This process plays a significant role in inflammatory-related diseases, such as atherosclerotic, neurological, and urological diseases [8], [9], [10]. Pyroptosis can be initiated by various pathological conditions, including oxidative stress. ATP is a key molecule in the non-classical pyroptosis pathway, and intracellular ATP levels tend to decrease during pyroptosis, which may be linked to cellular energy metabolism and oxidative stress [11], [12], [13]. As such, investigating changes in ATP and ONOO- levels in pyroptosis is essential to elucidate their mechanisms of action and relationships with various diseases.
The involvement of pyroptosis in the progression of acute kidney injury (AKI) has been reported [14], [15], [16]. AKI encompasses a group of clinical syndromes characterized by a sudden and profound deterioration in renal function, resulting in increased serum creatinine, decreased urine output, vascular dysfunction, intense inflammatory response, and tubular epithelial cell injury [17], [18]. Early detection and elimination of risk factors for acute tubular necrosis are crucial in preventing AKI, considering its diverse etiologies, with acute ischemia being one of the most common. Renal ischemia can damage vascular endothelial cells through an inflammatory response or inflammatory mediators produced by renal tubular cells, making ischemic AKI a stress-inflammatory disease. The release of superoxide anion and nitric oxide from glomerular capillary endothelial cells upregulates the levels of ONOO- through diffusion reactions in AKI. ONOO-‘s potent oxidative properties can induce apoptosis and necrosis of renal tubular epithelial cells and activate inflammatory reactions, leading to oxidative damage of the glomerular filtration membrane [19]. Normal renal cells require high levels of ATP to maintain physiological functions. However, in the context of AKI, the concentration of ATP decreases significantly due to the ischemic and hypoxic state of renal tissues, affecting intracellular metabolism and functions [20], [21], [22]. Previous studies have shown that ONOO- decreases ATPase activity, inhibits ATP synthesis, and ultimately downregulates ATP levels in renal tissue [23], [24]. Consequently, ATP and ONOO- are implicated in the onset and progression of AKI, and a detailed study of their interaction mechanisms will be beneficial for the early diagnosis and treatment of AKI [25].
For the past few years, numerous single-site near-infrared fluorescent (NIRF) probes have been developed for the specific monitoring of ATP or ONOO- levels in cells or in vivo[26], [27], [28], [29], [30], [31], [32], [33], [34], [35], [36], [37], [38], [39], [40], [41], [42], [43]. Nevertheless, NIRF probes capable of imaging both ATP and ONOO- with minimal emission spectra crosstalk are rare [44]. Addressing this challenge, we engineered two structurally novel dual-color readout NIRF probes by integrating rhodamine and methylene blue into a molecular backbone via diethylenetriamine or 1-(2-aminoethyl) piperazine linker. Among them, P2 offered superior anti-interference performance. Even in the simultaneous presence of ATP and ONOO-, P2 was able to differentiate between ATP and ONOO- with minimal spectral overlap in two distinct fluorescence channels, which greatly reduced the output of false-positive fluorescence signals in the detection process. The reaction of ATP or ONOO- with P2 triggered rhodamine ring-opening or methylene blue deformylation, which correspondingly showed intense fluorescence signals at 585 and 690 nm. This spectral change provided an intuitive and sensitive means of detecting ATP and ONOO- in cells and mice. Leveraging P2, it was not only possible to distinguish normal from cancer cells but also verified the existence of intracellular ATP and ONOO- interactions. Importantly, through dynamic monitoring of ATP and ONOO- level fluctuations in pyroptosis, uric acid (UA) was found to be a potential inhibitor of pyroptosis. For the first time, P2 was employed to demonstrate a negative correlation between the expression levels of ATP and ONOO- in AKI, characterized by increased ONOO- levels and decreased ATP levels. Overall, this innovative dual-color activated NIRF probe P2 afforded an indispensable chemical tool for elucidating the complex roles of ATP and ONOO- in pyroptosis associated with AKI.
Scheme 1. (a) The molecular structure of P1 and P2. (b) The strategy for designing dual-color fluorogenic probe P2 for ATP and ONOO-.
Fig. 1. Spectral characterization of 10 μM P1 or P2. (a-f) UV–vis and fluorescence spectra of P1 or P2 in the absence or presence of ONOO- (25 μM), ATP (15 mM), 15 mM ATP + 25 μM ONOO-, 25 μM ONOO- + 15 mM ATP. (g) Fluorescence responses of P2 to increase concentrations of ATP from 0 to 15 mM. (h) Time-dependent fluorescence intensity of P2 in the presence of ATP (0, 5, 10, 15 mM). (i) Fluorescence enhancement at 585 nm of P2 upon treatment with different potential interfering species: 1) blank; 2) ADP (10 mM); 3) AMP (10 mM); 4) H2PO4- (500 μM); 5) HPO42- (500 μM); 6) PO43- (500 μM); 7) CO32- (500 μM); 8) SO42- (500 μM); 9) NO3- (500 μM); 10) Cl- (500 μM); 11) Na+ (500 μM); 12) K+ (500 μM); 13) Mg2+ (200 μM); 14) Ca2+ (200 μM); 15) Zn2+ (200 μM); 16) GSH (1 mM); 17) D-glucose (1 mM); 18) ATP (15 mM). (j) Fluorescence responses of P2 to increase concentrations of ONOO- from 0 to 25 μM. (k) pH influence on fluorescence intensity at 690 nm of P2 before and after the addition of 25 μM ONOO-. (m) Fluorescence enhancement at 690 nm of P2 upon treatment with different potential interfering species: 1) blank; 2) H2PO4- (500 μM); 3) HPO42- (500 μM); 4) PO43- (500 μM); 5) CO32- (500 μM); 6) SO42- (500 μM); 7) NO3- (500 μM); 8) Na+ (500 μM); 9) K+ (500 μM); 10) Mg2+ (200 μM); 11) Ca2+ (200 μM); 12) Zn2+ (200 μM); 13) GSH (1 mM); 14) H2O2 (100 μM); 15) ClO- (100 μM); 16) ·OH (100 μM); 17) 1O2 (100 μM); 18) ONOO- (25 μM). λex/em = 530/585 nm (ATP channel), λex/em = 630/690 nm (ONOO- channel).
Fig. 2. Fluorescence imaging of ATP and ONOO- interactions in CNE1 cells. (a) The cells were treated with SIN-1 (1.0 mM), SIN-1 (1.0 mM) and UA (500 μM), Omy A (25 μM), Omy A (25 μM), and ATP (10 mM) for 1.0 h each, respectively, and then stained with P2 (20 μM) for 20 min. (b) Average fluorescence intensity of P2 labeled cells in images A (Ch 1, ATP). (c) Average fluorescence intensity of P2 labeled cells in images (a) (Ch 2, ONOO-). The data were shown as mean ± S.D. (* P < 0.05, ** P < 0.01, **** P < 0.0001, n = 3). Scale bar: 20 μm.
Fig. 3. Fluorescence imaging of ATP and ONOO- in normal and cancer cells. (a) NP69, CNE1, CNE2, and 5–8 F cells were incubated with P2 (20 μM) for 20 min. (b) Average fluorescence intensity of P2 labeled cells in images (a) (Ch 1, ATP). (c) Average fluorescence intensity of P2 labeled cells in images (a) (Ch 2, ONOO-). The data were shown as mean ± S.D. (*** P < 0.001, **** P < 0.0001, n = 3). Scale bar: 20 μm.
Fig. 4. Oxygen deprivation-induced pyroptosis of HK-2 cells. (a) The cells were pretreated with different concentrations of CoCl2·6 H2O (0.1 mM, 0.3 mM, 0.6 mM) for 24 h, and then stained with P2 (20 μM) for 20 min. (b) Average fluorescence intensity of P2 labeled cells in images (a) (Ch 1, ATP). (c) Average fluorescence intensity of P2 labeled cells in images (a) (Ch 2, ONOO-). (d) Cell viability of HK-2 cells upon treatment with different concentrations of CoCl2·6 H2O for 24 h. (e) Various concentrations of CoCl2·6 H2O pretreated HK-2 cells for 24 h induced the protein levels of C-caspase 1, N-GSDMD, and HIF-1α. (f – h) Relative expression of C-caspase 1, N-GSDMD, and HIF-1α proteins in HK-2 cells pretreated with different concentrations of CoCl2·6 H2O for 24 h. The data were shown as mean ± S.D. (* P < 0.05, ** P < 0.01, *** P < 0.001, **** P < 0.0001, n = 3). Scale bar: 20 μm.
Fig. 5. Oxygen-glucose deprivation-induced pyroptosis of HK-2 cells. (a) The cells treated with oxygen-glucose deprivation for different times (1 h, 2 h) were then stained with P2 (20 μM) for 20 min. (b) Average fluorescence intensity of P2 labeled cells in images (a) (Ch 1, ATP). (c) Average fluorescence intensity of P2 labeled cells in images (a) (Ch 2, ONOO-). (d) Cell viability of HK-2 cells under different times of oxygen-glucose deprivation. (e) Different oxygen-glucose deprivation times induced protein levels of C-caspase 1, N-GSDMD, and HIF-1α in HK-2 cells. (f – h) Relative expression of C-caspase 1, N-GSDMD, and HIF-1α proteins in HK-2 cells under various oxygen-glucose deprivation times. The data were shown as mean ± S.D. (* P < 0.05, ** P < 0.01, *** P < 0.001, **** P < 0.0001, n = 3). Scale bar: 20 μm.
Fig. 6. Protective effect of UA on HK-2 cells post-I/H. Control group: no treatment; 2 h + DMSO: 2 h of I/H while adding 5 μL of DMSO per ml of the medium; 2 h + UA: 2 h of I/H with simultaneous addition of UA (500 μM). (a) The cells treated with oxygen-glucose deprivation for different times (1 h, 2 h) were then stained with P2 (20 μM) for 20 min. (b) Average fluorescence intensity of P2 labeled cells in images (a) (Ch 1, ATP). (c) Average fluorescence intensity of P2 labeled cells in images (a) (Ch 2, ONOO-). (d) Cell viability of HK-2 cells under 2 h + DMSO, 2 h + UA treatments. (e) 2 h + DMSO, 2 h + UA induced protein levels of C-caspase 1, N-GSDMD, and HIF-1α in HK-2 cells. (f – h) Relative expression of C-caspase 1, N-GSDMD, and HIF-1α proteins in HK-2 cells under 2 h + DMSO, 2 h + UA treatments. The data were shown as mean ± S.D. (* P < 0.05, ** P < 0.01, *** P < 0.001, **** P < 0.0001, n = 3). Scale bar: 20 μm.
4. Conclusion
In summary, we have disclosed a novel NIRF probe P2 with dual-color fluorescence emission and harnessed it for the simultaneous detection of ATP and ONOO- in vitro and in vivo. P2 possessed outstanding optical properties for imaging intracellularly endogenous and exogenous ATP and ONOO- and distinguishes between cancerous and normal cells. The research unveiled an interplay between ATP and ONOO-, with an imbalance closely related to pyroptosis and AKI. Utilizing the dual-color imaging capability of P2, the dynamics of ATP and ONOO- during pyroptosis were sensitively monitored. In the CoCl2·6 H2O and oxygen-glucose deprivation-stimulated HK-2 cell experiments, not only did WB analysis reveal that cellular pyroptosis was triggered via the caspase-1-dependent classical pathway, but also a significant increase in the level of ONOO- and a decrease in the level of ATP were observed. Moreover, UA was found to have a prominent cytoprotective effect, suggesting its potential as a therapeutic agent through the inhibition of pyroptosis. Benefitting from P2, we successfully tracked changes in ATP and ONOO- levels in the AKI mice model. Specifically, ONOO- levels were dramatically elevated in the kidneys of AKI mice, while ATP levels initially declined and then gradually recovered with the prolongation of reperfusion time. These findings further demonstrated the detection and diagnostic potential of P2 in the process of AKI. We believed that an in-depth exploration of ATP and ONOO- interactions would offer valuable insights into the development of innovative diagnostic and therapeutic approaches for related diseases.
Novel CeF3:Tm3+, Er3+ nanoparticles: NIR up-down conversion luminescence properties based on energy transfer of Tm3+ and Ce3+
a
Hunan Provincial Key Laboratory of Fine Ceramics and Powder Materials, Hunan University of Humanities, Science and Technology, Lou’di, Hunan, 417000, China
b
Key Laboratory of Hainan Trauma and Disaster Rescue, The First Affiliated Hospital of Hainan Medical University, Hainan Medical University, Haikou, 571199, China
c
Engineering Research Center for Hainan Bio-Smart Materials and Bio-Medical Devices, Key Laboratory of Emergency and Trauma, Ministry of Education, Key Laboratory of Hainan Functional Materials and Molecular Imaging, College of Emergency and Trauma, Hainan Medical University, Haikou, 571199, China
Received 10 January 2024, Revised 27 April 2024, Accepted 9 May 2024, Available online 10 May 2024, Version of Record 13 June 2024.
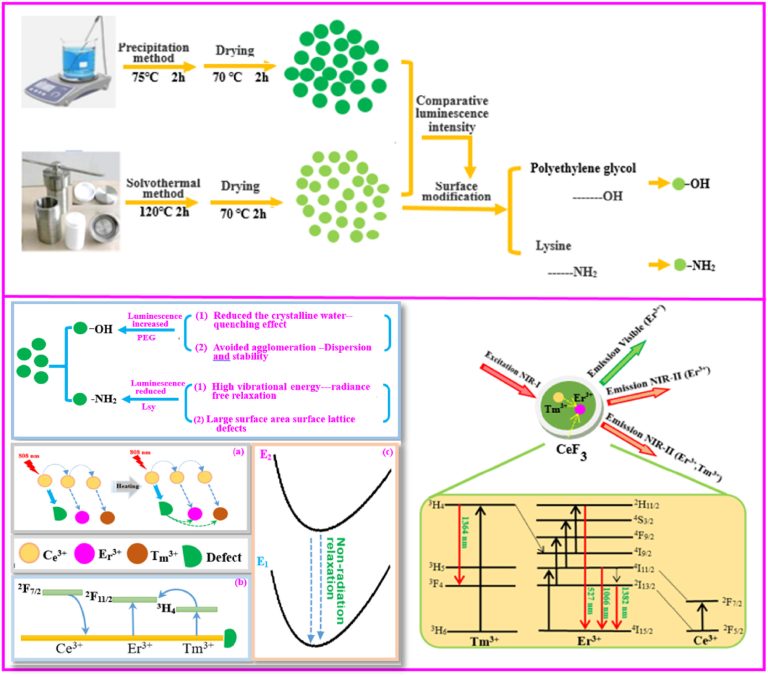
A novel CeF3:Tm3+, Er3+ NIR up-down conversion luminescent nanoparticles with highly efficient visible and near-infrared second window (NIR-II) emission were synthesized by direct precipitation and hydrothermal methods. The two different emission modes of visible-NIR II light of Er3+were realized through the energy transfer of Tm3+ and Ce3+at the excitation wavelength of 808 nm. Which successfully combined the narrow emission peaks of visible light and the deep tissue penetration advantage of NIR-II. First, the effects of preparation conditions on the structure, morphology, stability and luminescence properties of CeF3:Tm3+, Er3+ nanoparticles were analyzed by XRD, SEM, TEM and PL. The results showed that the crystallinity, morphology and luminescence intensity of CeF3:Tm3+,Er3+ nanoparticles produced by hydrothermal method (reaction time of 10 h) were optimal compared with that of direct precipitation method. CeF3: Tm3+,Er3+ nanoparticles has better thermal stability, and fluorescence lifetime of 5D0→7F2 (525 nm), 4I15/2→4I11/2 (1066 nm) and 4I15/2→4I13/2 (1386 nm) for Er3+ are 15.51 ns, 48.78 us and 57.06 us, separately. At the same time, the surface of CeF3:Tm3+, Er3+ nanoparticles was modified by PEG and Lys. And then the effects of the surface modification on the hydration size, zeta potential and up-down conversion luminescent properties (visible and NIR-II light emission) were investigated. The results show that the modification of PEG effectively slows down the agglomeration of CeF3:Tm3+, Er3+ nanoparticles and improves their stability and dispersion under the same conditions. More importantly, the modification of PEG effectively increases the up-conversion luminescence intensity of CeF3:Tm3+, Er3+ nanoparticles under 808 nm excitation. Moreover, the CeF3:Tm3+, Er3+-PEG nanoparticles with 20–40 nm showed stronger NIR up-down conversion emission intensity in aqueous solutions (pH = 5,6,7) and better thermal stability. Furthermore, the CeF3:Tm3+, Er3+-PEG nanoparticles has low cytotoxicity and good biocompatibility. This study provides a theoretical basis for the development of high-performance rare-earth NIR up-down conversion luminescence materials.
Introduction
NIR-II fluorescence imaging has longer excitation wavelengths and emission wavelengths (1000 nm–1700 nm), which can significantly reduce the light scattering rate and improve the depth of penetration in organisms [1,2]. Moreover, NIR-II fluorescence also has the advantages of low auto-fluorescence effect and high resolution [3,4]. However, only very few NIR-II fluorescence imaging materials can meet the current requirements of in vivo imaging, such as single-walled carbon nanotubes and carbon dots (low fluorescence quantum yield) [5], organic dyes (poor photo-stability) [6] and quantum dots (high toxicity) [7] etc. All of these materials are unable to be clinically applied due to their own defects. However, rare-earth NIR-II imaging materials have long fluorescence lifetime, low auto-fluorescence, high imaging signal-to-noise ratio, deep tissue penetration ability (5–20 mm), and low toxicity, which have a broad application prospect in the field of cancer diagnosis and treatment [8]. So far, the main activator rare-earth ions emitted in NIR II are Nd3+ (1060/1300 nm), Tm3+ (1470 nm), Pr3+ (1310 nm), Ho3+ (1185 nm) and Er3+ (1525 nm) [9]. For example, literature [[10], [11], [12], [13], [14]] reported that the MLnF4 (M = Na, Li; Ln = Gd, Dy, Er, Ce, Nd) luminescent nanoparticles with co-doped or mono-doped Nd3+, Tm3+, Pr3+, Ho3+ and Er3+ ions could be used as a NIR-II fluorescent probe under the excitation at 808 or 980 nm. LaF3 [15], MF2 (M = Sr, Ca) [16], GdPO4 [17], and CaS [18] luminescent nanoparticles with co-doped or mono-doped Nd3+, Tm3+, Pr3+, Ho3+, and Er3+ ions can also be used for NIR-II fluorescence imaging under 808 or 980 nm excitation in vivo, which has potential applications in tumor diagnosis and treatment. In addition, the rare-earth up-conversion luminescence requires only a low power density NIR laser (808 or 980 nm), which is low cost and more universality compared to two-photon laser excitation with high power density [19]. Among them, 808 nm is not easily absorbed by water compared to 980 nm, its absorption coefficient is only 0.023 cm−1, [19]. According to the photon transmission theory, when the light at 808 nm is irradiated on the biological tissue, the absorption of the tissue surface is very small, and the light can penetrate the deeper biological tissue. And the volume effect of light at 808 nm is large, making the biological tissue easier to solidify (the stronger the hemostatic function) [19]. Therefore, it is more suitable for the imaging field of vascular-rich deep biological tissue. More importantly, the NIR-excited rare earth nanoparticles have the tunable up- and down-conversion luminescence property, which can emit the broad-wave multiple emissions from ultraviolet/visible (UV/Vis) to NIR-II, making them ideal fluorescent probes [20]. However, the currently reported up-and down-convertion emission materials based on a single activator inhibit up-conversion luminescence efficiency and NIR-II luminescence efficiency.
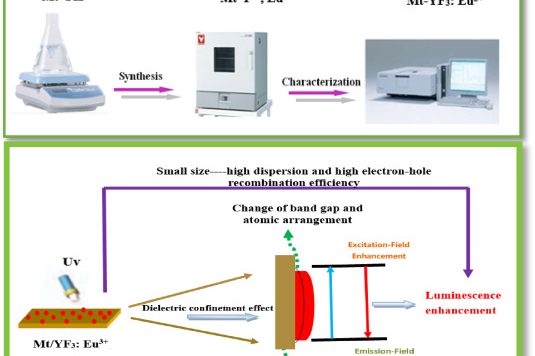
Based on the above research status, a novel CeF3:Tm3+, Er3+ NIR up-down conversion luminescent materials with strong visible and NIR-II luminescence have been synthetized by direct precipitation and hydrothermal methods (Fig. 1). Firstly, the effects of different preparation methods and reaction conditions on the structure, morphology and luminescence properties of CeF3:Tm3+, Er3+ NIR up-down conversion luminescent nanoparticles were investigated. Then, the surface of CeF3:Tm3+, Er3+ nanoparticles modified by polyethylene glycol (PEG) and lysine (Lys). The effects of surface modifiers on the hydration particle size, zeta potential, luminescence properties were investigated in aqueous solutions with different pH values. Finally, the thermal stability and biocompatibility properties of CeF3:Tm3+, Er3+ NIR up-down conversion luminescent nanoparticles were investigated.
Compared with the reported research work [[30], [31], [32], [33], [34], [35]], the highlights of this research work are as follows: (1) Novel CeF3:Tm3+, Er3+ up-down conversion luminescent nanoparticles with small size and high stability were synthesized by direct precipitation and hydrothermal methods. Novel CeF3:Tm3+, Er3+ up-down conversion luminescent nanoparticles successfully combined advantage of the narrow emission peak of visible fluorescence with the deep tissue penetration advantage of NIR-II. (2) The influence of the preparation method and experiment condition of novel CeF3:Tm3+, Er3+up-down conversion luminescent nanoparticles on the luminescence performance was systematically studied, and the optimal preparation conditions were determined. (3) The influence and mechanism of surface modification on the dispersion stability and luminescence properties in different aqueous solutions (pH = 5–7) of novel CeF3:Tm3+, Er3+ up-down conversion luminescent nanoparticles were studied. (4) It reveals the influence mechanism of the surface modification and temperature change of novel CeF3:Tm3+, Er3+ up-down conversion luminescent nanoparticles on up-down conversion luminescent property.
The preparation and investigations on NIR up-down conversion luminescence properties of Novel CeF3:Tm3+, Er3+ nanoparticles with small size, high stability, biocompatibility and strong luminescence (visible and NIR-II emission) is expected to provide a practical innovative idea for the development of high-performance rare-earth NIR up-down conversion luminescence materials, therefore, it has important practical significance and research value.
Fig. 1. Schematic diagram of synthesis and luminescent property of novel CeF3:Tm3+, Er3+ NIR up-down conversion nanoparticles: (a) Negative heat quenching
mechanism, (b) Defects capture and release electrons in the crystals, (c) Multi-assisted non-radiative relaxation.
Fig. 2. XRD patterns of CeF3:Tm3+, Er3+ nanoparticles produced by hydrothermal method (a) and direct precipitation method (b).
Fig. 3. SEM images of CeF3:Tm3+,Er3+ nanoparticles obtained by hydrothermal method. (a-2 h) (b-4 h) (c-6 h) (d-8 h) (e 10 h).
Fig. 4. SEM images of CeF3:Tm3+, Er3+ nanoparticles obtained by direct precipitation method (a-S1) (b-S2) (c-S3) (d-S4) (e-S5).
Fig. 5. Up-down conversion emission spectra of CeF3:Tm3+, Er3+ nanoparticles produced by hydrothermal method.
Fig. 6. Up-down conversion emission spectra of CeF3:Tm3+, Er3+ nanoparticles obtained by direct precipitation method.
Fig. 7. (a~d) TEM images of CeF3:Tm3+, Er3+ nanoparticles (hydrothermal method, 10 h).
Fig. 8. (a,b) TEM and (c ~ g) Energy Dispersive X-ray (EDX) mapping of CeF3:Tm3+, Er3+ nanoparticles.
Fig. 9. TG plot of the CeF3:Tm3+, Er3+ nanoparticles.
Fig. 10. The temperature stability spectra of CeF3:Tm3+, Er3+ nanoparticles.
Fig. 11. Fluorescent decay curves of 5D0-7F2 (525 nm), 4I15/2 → 4I11/2 (1066 nm) and 4I15/2 → 4I13/2 (1386 nm) for Er3+.
Fig. 12. The infrared spectra of CeF3:Tm3+, Er3+, CeF3:Tm3+, Er3+-Lys and CeF3:Tm3+, Er3+-PEG nanoparticles.
Table
Fig. 13. Up-down conversion fluorescence spectra of CeF3:Tm3+, Er3+, CeF3: Tm3+, Er3+-PEG and CeF3:Tm3+, Er3+-Lys nanoparticles.
Fig. 14. Up- and down-conversion emission spectra of CeF3:Tm3+, Er3+-PEG nanoparticles in aqueous solutions (pH = 5, 6, 7).
Fig. 15. Cell viability of HeLa cells treated with different concentrations of CeF3:Tm3+,Er3+-PEG nanoparticles at 24 h (0 mg/ml is Control group, *P < 0.05, **P < 0.01).
Conclusion
In this paper, novel CeF3: Tm3+,Er3+ NIR up- and down-conversion luminescent nanoparticles was synthesized by direct precipitation and hydrothermal methods. Through Tm3+- Er3+-Ce3+ energy transfer process, to realize visible light and NIR-II emission modes of Er3+ at the excitation wavelength of 808 nm. And novel CeF3: Tm3+,Er3+ nanoparticles has better thermal stability, biocompatibility and fluorescence properties. Meanwhile, the effects of PEG, Lys and pH on the hydrated particle size, stability and luminescence intensity of CeF3: Tm3+,Er3+ luminescent nanoparticles were investigated. The results show that the CeF3: Tm3+, Er3+-PEG nanoparticles still has good luminescence performance in aqueous solution, and it can be used as a good fluorescent probe because it still maintains a small hydrated particle size and good dispersion under acidic solution conditions. This work brings a new idea to combine the narrow emission peak of visible fluorescence with the deep tissue penetration advantage of NIR-II.
Rationally designed an innovative proximity labeling near-infrared fluorogenic probe for imaging of peroxynitrite in acute lung injury
,,,,,,
a
Key Laboratory of Emergency and Trauma of Ministry of Education, Department of Radiotherapy, The First Affiliated Hospital of Hainan Medical University, Hainan Medical University, Haikou 571199, China
b
Key Laboratory of Hainan Trauma and Disaster Rescue, Key Laboratory of Haikou Trauma, Engineering Research Center for Hainan Bio-Smart Materials and Bio-Medical Devices, College of Emergency and Trauma, Hainan Medical University, Haikou 571199, China
Received 8 April 2024, Revised 30 May 2024, Accepted 2 June 2024, Available online 3 June 2024.
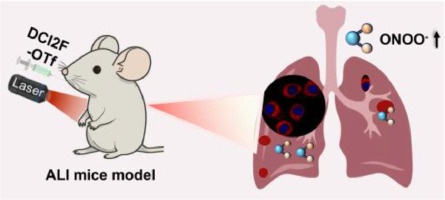
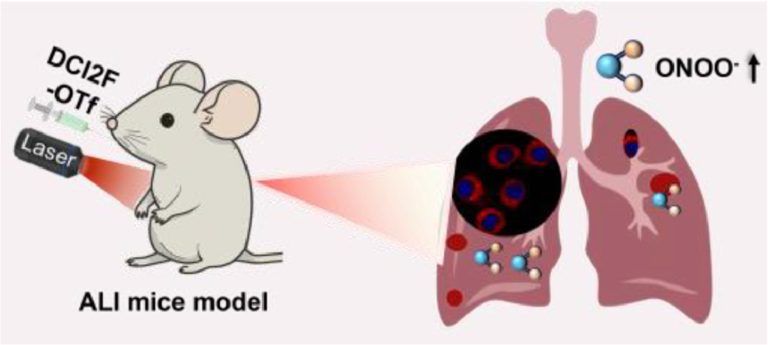
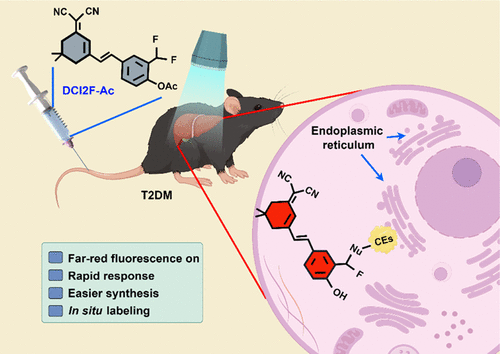
Acute lung injury (ALI) is a serious clinical condition with a high mortality rate. Oxidative stress and inflammatory responses play pivotal roles in the pathogenesis of ALI. ONOO− is a key mediator that exacerbates oxidative damage and microvascular permeability in ALI. Accurate detection of ONOO− would facilitate early diagnosis and intervention in ALI. Near-infrared fluorescence (NIRF) probes offer new solutions due to their sensitivity, depth of tissue penetration, and imaging capabilities. However, the developed ONOO− fluorescent probes face problems such as interference from other reactive oxygen species and easy intracellular diffusion. To address these issues, we introduced an innovative self-immobilizing NIRF probe, DCI2F-OTf, which was capable of monitoring ONOO− in vitro and in vivo. Importantly, leveraging the high reactivity of the methylene quinone (QM) intermediate, DCI2F-OTf was able to covalently label proteins in the presence of ONOO−, enabling in situ imaging. In mice models of ALI, DCI2F-OTf enabled real-time imaging of ONOO− levels and found that ONOO− was tightly correlated with the progression of ALI. Our findings demonstrated that DCI2F-OTf was a promising chemical tool for the detection of ONOO−, which could help to gain insight into the pathogenesis of ALI and monitor treatment efficacy.
Graphical Abstract
An innovative self-immobilizing NIRF probe DCI2F-OTf was capable of monitoring ONOO− in vitro and in vivo. DCI2F-OTf was able to covalently label proteins in the presence of ONOO−, enabling in situ imaging. In mice models of ALI, DCI2F-OTf enabled real-time imaging of ONOO− levels and found that ONOO− was tightly correlated with the progression of ALI.
Scheme 1. (a) Schematic illustration of dual sensing and labeling NIRF probe DCI2F-OTf for ONOO–. (b) Synthesis of NIRF probe DCI2F-OTf.
Figure 1. Fluorescence response of DCI2F-OTf (10 μM) to ONOO– excited at 490 nm. (a) Visualization of the fluorescence changes of DCI2F-OTf during titration with increasing ONOO– (0 – 35 μM) concentrations. (b) Linearity of the fluorescence intensity value of DCI2F-OTf at 652 nm with varied concentrations of ONOO– (5 – 35 μM). (c) Time-dependent fluorescence response of DCI2F-OTf before and after the addition of ONOO– (70 μM) at 37 °C recorded every 5 min. (d) The fluorescence intensities at 652 nm of DCI2F-OTf in the absence or presence of ONOO– (70 μM) over pH range from 3.0 to 7.0. (e) Values of fluorescence intensities of DCI2F-OTf treated with different competitive biological agents: 1. blank, 2. Na+ (500 μM), 3. K+ (500 μM), 4. Ser (200 μM), 5. Leu (200 μM), 6. Arg (200 μM), 7. S2O32- (100 μM), 8. HSO3– (100 μM), 9. H2S (100 μM), 10. Cys (100 μM), 11. GSH (1 mM), 12. NO2– (100 μM), 13. NO3– (100 μM), 14. NO (100 μM), 15. •OH (100 μM), 16. O21 (100 μM), 17. H2O2 (100 μM), 18. O2•– (100 μM), 19. HOCl (100 μM), 20. ONOO– (70 μM). (f) SDS-PAGE analysis of BSA (5 mg/mL) after incubation with DCI2F-OTf + ONOO–, DCI2F-OTf, DCI2F-OTf + ONOO– + UAin PBS at 37 ℃ for 30 min. Left: Coomassie brilliant blue staining; right: fluorescence imaging. λex/λem = 490/650 nm.
Figure 2. (a) RAW264.7 cells were pretreated with SIN-1 (200 μM, 30 min) or stimulated with LPS (1.0 μg/mL), IFN-γ (100 ng/mL) for 12 h, PMA (10 nM) for 30 min, and then incubated with DCI-OTf (10 μM, 30 min) or DCI2F-OTf (10 μM, 30 min), respectively. The red channel was collected in the range of 600-700 nm (λex = 488 nm) and the Hoechst channel was collected in the range of 430-480 nm (λex = 405 nm). (b) A549 cells were pretreated with SIN-1 (200 μM, 30 min), followed by incubation with DCI2F-OTf (10 μM, 30 min) or DCM-KA (10 μM, 30 min), before or after washout with fresh DMEM (three times, each for 6 min). (c) Normalized fluorescence intensity plots of DCI2F-OTf and DCM-KA labeled cells in (b) (n = 3). Scale bar: 50 μm.
Figure 3. (a) RAW264.7 cells pretreated with different concentrations of SIN-1 (0, 50, 100, 200 μM), SIN-1 (200 μM) plus ebselen (200 μM) for 30 min were incubated with DCI2F-OTf (10 μM) for 30 min. (b) The pixel intensity of DCI2F-OTf labeled cells in (a). (c) The protein levels of iNOS and IL-6 were detected by western blot analysis. (d) The relative protein expression level of iNOS and IL-6 in (c). (e) RAW264.7 cells were pretreated with SIN-1 (200 μM, 30 min), and then incubated with DCI2F-OTf (10 μM) for 0 – 30 min. (f) Flow cytometry analysis of DCI2F-OTf (10 μM) labeled SIN-1 (200 μM, 30 min) pretreated cells. Error bars represent s.d., n=3. Scale bar: 50 μm.
Figure 4. (a) RAW264.7 cells were pretreated with the stimulus LPS (1.0 μg/mL)/IFN-γ (100 ng/mL) for different periods (0, 3, 6, 12 h), PMA (10 nM) for 30 min or LPS (1.0 μg/mL)/IFN-γ (100 ng/mL) plus UA (200 μM) for 12 h, PMA (10 nM) for 30 min, and then incubated with DCI2F-OTf (10 μM) for 30 min. (b) RAW264.7 cells were pretreated with LPS (0, 0.25, 0.5, 1.0 μg/mL)/IFN-γ (100 ng/mL), PMA (10 nM), or LPS (1.0 μg/mL)/IFN-γ (100 ng/mL) plus AG (1 mM) for 12 h, PMA (10 nM) for 30 min, and then incubated with -OTf (10 μM) for 30 min. (c) The pixel intensity of DCI2F-OTf labeled cells in (a). (d) The protein levels of iNOS, IL-6, and NF-𝜅B were detected by western blot analysis. (e) The relative protein expression level of iNOS, IL-6, and NF-𝜅B in (c). (f) The pixel intensity of DCI2F-OTf labeled cells in (b). Error bars represent s.d., n=3. Scale bar: 50 μm.
Figure 5. (a) NIRF images of control and LPS-stimulated mice after intravenous administration of DCI2F-OTf (200 μM, 45 μL). (b) NIRF imaging and photographs of dissected major organs (1: heart, 2: kidney, 3: liver, 4: spleen, 5: lung) from mice in panel (a). (c) The histogram presents the average radiant efficiency of mice in panel (a). (d) The histogram presents the average radiant efficiency of the lung in panel (b). (e) H&E staining histological images for lung tissue in control and LPS-stimulated mice. Scale bar: 50 μm. (f-h) Serum levels of inflammatory factors TNF-α, IL-6, and IL-1β in control and LPS-stimulated mice. (i) The protein levels of iNOS, COX-2, NF-κB, and IL-6 were detected by western blot analysis. (j-n) The relative protein expression level of iNOS, COX-2, NF-κB, and IL-6 in (i). (o-p) Sections of lung tissue were immunostained with an antibody that detected 3-NT. Scale bar: 50 μm. (q) NIRF images of mice fresh lung tissue sections from ALI mice in the LPS6 group. The confocal Z-axis scan images at 0, 5, 10, 15, 20, 25, 30, 35, 40, 45, and 50 µm penetration depths. λex = 488 nm; red channel: λem = 600 – 700 nm.
Conclusion
In conclusion, we have designed a novel NIRF probe, DCI2F-OTf, for fluorescence imaging ONOO– in live cells and mice model of ALI. Under physiological conditions, DCI2F-OTf was highly sensitive and selective for ONOO– and yielded a linear response to ONOO over a wide concentration range from 0 to 70 μM. The QM covalently labeled neighboring proteins released from the reaction of DCI2F-OTf with ONOO– could solve the problem of intracellular diffusion of the probe, enabling precise imaging of intracellular ONOO–. This strategy was superior to the vast majority of ONOO– probes that have been developed so far. The excellent sensing performance and NIRF emission characteristics enable DCI2F-OTf to image ONOO– levels in mice and tissues with ALI. In vivo imaging results indicated that SFN significantly down-regulated the oxidative stress level, thereby attenuating the severity of LPS-induced ALI, and could exert a protective role against ALI. Therefore, DCI2F-OTf was a valuable tool for studying the physiological function of ONOO– and was expected to facilitate the understanding of oxidative stress diseases such as ALI and the rapid screening of corresponding therapeutic drugs.
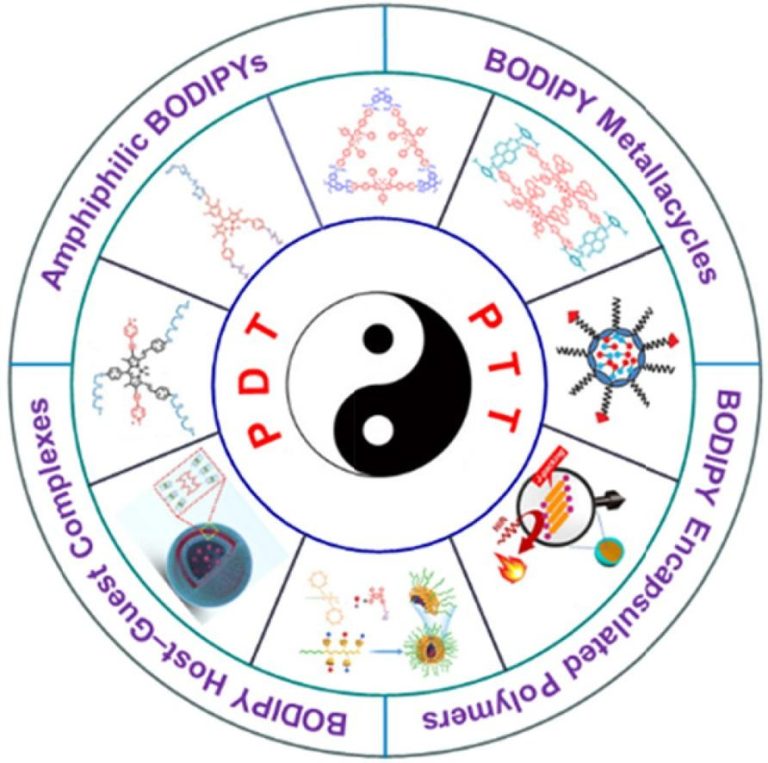
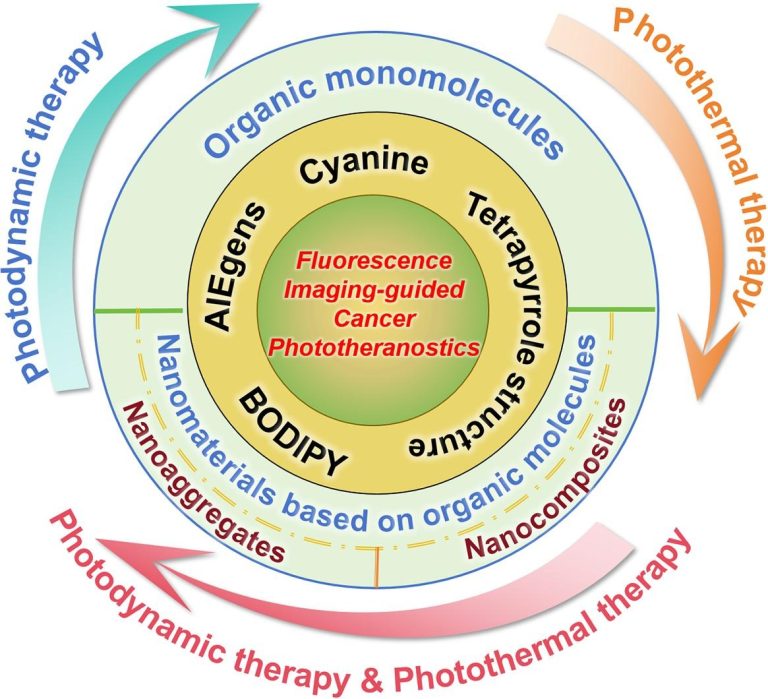
Supramolecular assembly boosting the phototherapy performances of BODIPYs
Author links open overlay panel,,,,,,,,,
a
College of Chemical and Biological Engineering, Shandong University of Science and Technology, 579 Qianwangang Road, Qingdao 266590, China
b
State Key Laboratory of Fine Chemicals, Frontiers Science Center for Smart Materials, School of Chemical Engineering, Dalian University of Technology, Dalian 116024, China
c
Department of Chemistry, College of Sciences, Northeastern University, Shenyang 110819, China
d
Key Laboratory of Hainan Trauma and Disaster Rescue, Key Laboratory of Haikou Trauma, The First Affiliated Hospital of Hainan Medical University, Hainan Medical University, Haikou 571199, China
e
Shandong Haihua Group Co., Ltd, Weifang 262737, China
Received 22 May 2024, Accepted 23 June 2024, Available online 2 July 2024, Version of Record 2 July 2024.
•Supramolecular assembly can effectively overcome the limitations of BODIPYs and boosted their phototherapy performances.
•Supramolecular assembly improved the water solubility and biocompatibility of BODIPYs.
•Supramolecular assembly enhanced their penetration into deeper tissues, increased its permeability and retention in tumor environments.
•Supramolecular assembly boosted the yields of reactive oxygen species and photothermal conversion efficiencies of BODIPYs.
•BODIPY-based supramolecular systems are poised to significantly advance and play a growing role in anti-tumor treatments.
Highlights
•Supramolecular assembly can effectively overcome the limitations of BODIPYs and boosted their phototherapy performances.
•Supramolecular assembly improved the water solubility and biocompatibility of BODIPYs.
•Supramolecular assembly enhanced their penetration into deeper tissues, increased its permeability and retention in tumor environments.
•Supramolecular assembly boosted the yields of reactive oxygen species and photothermal conversion efficiencies of BODIPYs.
•BODIPY-based supramolecular systems are poised to significantly advance and play a growing role in anti-tumor treatments.
Introduction
Cancer remains a major global health challenge, causing millions of deaths annually and persistently affecting human lives and wellbeing. Consequently, there is an urgent need to develop more effective anti-cancer therapies. Traditional treatments such as chemotherapy and radiotherapy, while widely applicated, are often limited by substantial systemic toxicity and adverse side effects [1], [2], [3], [4], [5]. In response to these limitations, novel clinical approaches such as photodynamic therapy (PDT) and photothermal therapy (PTT) have gained prominence. These phototherapies offer numerous advantages, including high selectivity, minimal toxic side effects, absence of drug resistance, and potent immune activation, positioning them at the cutting edge of research in chemistry, materials science, and medicine [6], [7], [8], [9], [10], [11]. According to the Jablonski diagram in Fig. 1, photosensitizers (PSs), light, and tissue oxygen are the three key components of PDT applications. PDT operates on the principle of electron or energy transfer from triplet PSs to surrounding oxygen molecules, leading to the generation of reactive oxygen species (ROS). These different ROS types, which include a variety of type I radicals like hydroxyl (•OH) and superoxide (O2−•), or singlet oxygen (1O2, type II), inflict cellular damage primarily through photochemical reactions that induce apoptosis in cancer cells [2], [3], [6], [12], [13], [14], [15]. The effectiveness of PDT hinges on the ability of PSs to generate a high yield of ROS while exhibiting low toxicity in the absence of light (dark toxicity), efficiently penetrating deep tissues, and demonstrating effective accumulation within the tumor site. These attributes are essential for targeting tumor tissues and inhibiting tumor growth when illuminated under specific light wavelengths. Thus, advancing the design and functional capabilities of PSs is crucial for enhancing the therapeutic outcomes of PDT [2], [3], [16], [6], [7], [8]. However, the limitation inherent to singular treatments of PDT is highly oxygen-dependent, especially in hypoxic tumors [17], [18]. Therefore, developing novel treatment modalities is crucial.
Similarly, PTT has become another prevalent phototherapy strategy for cancer treatment, capitalizing on the susceptibility of tumor cells to heat-induced apoptosis [9], [10], [19], [20], [21]. Unlike PDT, PTT does not rely on tissue oxygen and can effectively be carried out in hypoxic conditions. During PTT, photothermal agents (PTAs) absorb light at specific wavelengths and convert this energy into heat through non-radiative relaxation processes from the excited states to ground state, leading to tumor cell apoptosis (Fig. 1) [20], [21], [22], [23]. However, PTT tends to require high-intensity laser irradiation during treatments, since the limited transmission ability of low-intensity laser cannot penetrate deep into the organism, resulting in a lack of effective treatments for internal tumors. Thus, the single treatment of PTT is often difficult to achieve the expected effects. It can be mitigated by synergistic therapies with the other treatment modalities such as PDT or chemotherapy, combining the strengths of them [1], [11], [13], [16], [24].
Fig. 1. Schematic illustration of Jablonski diagram for the principles of PDT and PTT. Reproduced with permission [12]. Copyright 2020, the Royal Society of Chemistry.
Among various traditional PSs and PTAs characterized by planar, rigid conjugated structures, such as porphyrins [2], [10], [16], [25], [26], [27], [28], phthalocyanine [8], [29], [30], [31], [32], and perylene bisimide [5], [22], [31], [32], [33], boron dipyrromethene (BODIPY) stands out due to its distinct photochemical and photophysical properties. Since their discovery in 1968, BODIPYs, known for their intense light-absorption capabilities, high fluorescence quantum yields, long triplet excited state lifetimes, ease of functionalization, and excellent photostability, have been extensively explored for applicating in phototherapies [24], [34], [35], [36], [37], [38], [39]. Over the past few decades, the structural functionalization and applications of BODIPYs in both PDT and PTT have been rigorously investigated [3], [24], [40], [41], [42], [43], [44]. However, several inherent challenges hinder the broader application of free BODIPY molecules in PDT and PTT. For instance, their hydrophobicity, stemming from planar and rigid structures, limits their water solubility, which is crucial for biological applications. Additionally, their high fluorescence quantum yields and propensity to aggregate in water diminish their ability to generate ROS, severely impacting their effectiveness in PDT [3], [24], [34], [40], [41]. In this context, we will summarize these issues and highlight the ongoing evolution of BODIPY-based phototherapies for overcoming their limitations for enhanced cancer therapy.
Supramolecular assembly, leveraging non-covalent interactions such as hydrogen bonds, van der Waals forces, π–π interactions, and hydrophobic and hydrophilic interactions, offers an effective pathway to circumvent complex organic synthesis processes. This strategy has facilitated the construction of functional materials and has seen significant advancements over the last several decades [45], [46], [47], [48]. Notably, the rapid progress in supramolecular assembly has introduced innovative approaches to enhance the properties of BODIPYs, addressing their previous limitations. These advancements include improving water solubility and biocompatibility, shifting absorption towards the near-infrared (NIR) region, and increasing tumor accumulation and retention, collectively enhancing the performance of BODIPYs in both PDT and PTT therapies [25], [49], [50], [51], [52], [53]. By employing thoughtful design and functionalization, BODIPYs can be structured into supramolecular assemblies that exhibit red-shifted absorption suitable for deep tissue penetration, alongside enhanced biocompatibility and water solubility. This structural and functional tailoring not only facilitates more efficient tumor targeting but also improves the generation of ROS or heat during therapy, opening up vast prospects in PDT and PTT applications [1], [3], [6], [24], [37], [43], [44]. Fortunately, the facial functionalized structures of BODIPYs makes them ideal candidates as versatile building blocks for supramolecular assemblies. Recent research has made significant strides in enhancing the PDT and PTT efficacies of BODIPYs through supramolecular strategies, as demonstrated by numerous studies in recent years [3], [6], [24], [40], [42], [35], [36], [37]. Despite the breakthroughs of supramolecular assembling strategies significantly improving the performances of BODIPYs in anti-cancer phototherapies, several persisting issues and challenges must be addressed to advance their clinical applications further [24], [50]. To provide more valuable resource for researchers keen on exploring and contributing to this promising field of cancer therapy and facilitate their translation into clinical settings, systematically reviewing the latest advancements and ongoing hurdles in the formation of various BODIPY-based assemblies for single or synergistic therapies of PDT and PTT is crucial.
In this review, we aim to comprehensively summarize the strategies and existing challenges associated with designing and constructing various types of BODIPY-based assemblies for both single and synergistic treatments involving PDT and PTT. The construction of BODIPY-based assemblies has been primarily achieved through the following monomers, polymers or complexes (Table 1, Table 2, Table 3, Table 4, Table 5, Table 6): (1) amphiphilic BODIPY molecules; (2) BODIPY-based metal-coordinated macrocycles and heavy-atom-free cyclic BODIPY arrays; (3) BODIPY-encapsulated amphiphilic polymers; and (4) BODIPY-involved host–guest complexes. Each section of this review delves into the optimal design strategies and functional mechanisms of BODIPY-based assemblies, which are extensively discussed and illustrated through numerous figures (Fig. 2, Fig. 3, Fig. 4, Fig. 5, Fig. 6, Fig. 7, Fig. 8, Fig. 9, Fig. 10, Fig. 11, Fig. 12, Fig. 13, Fig. 14, Fig. 15, Fig. 16, Fig. 17, Fig. 18, Fig. 19, Fig. 20, Fig. 21, Fig. 22, Fig. 23, Fig. 24, Fig. 25, Fig. 26, Fig. 27, Fig. 28, Fig. 29, Fig. 30). Additionally, we provide in-depth insights into the therapeutic effects of selected BODIPY-based assemblies, demonstrated through both in vitro and in vivo experiments. These results are critically assessed to underscore their potential for advancing clinical phototherapy applications. This review is crafted to serve as a timely and essential resource for researchers and clinicians interested in the emerging field of supramolecular phototherapies involving BODIPY assemblies. We hope to foster widespread interest and encourage further innovative studies within the phototherapy domain.
Section snippets
Self-assembly of amphiphilic BODIPYs
Since BODIPY cores are composed of organic aromatic compounds, their planar rigid conjugated structures impose significant limitations on water solubility and hinder their biological applications [3], [73]. By incorporating hydrophilic groups, functionalized BODIPYs with amphiphilic structures can self-assemble into various nanostructures, including nanoparticles (NPs), nano-vesicles, and nano-micelles. These nanostructures open up novel opportunities and provide insightful approaches for
Fig. 2. (I) Schematic illustration of molecular structures of PolyFBODIPY, PSDE and PD, self-assembling NP@PolyFBODIPY, generating ROS, and decomposing to release
PSs. (II) Inhibition of tumor growth on a murine cancer model PDXMDR by NP@PolyFBODIPY. (III) Cell viability of PDCMDR cells incubated with NP@PolyBODIPY and
NP@PolyFBODIPY and exposed to irradiation under normoxic or hypoxic conditions. (IV) Tumor growth inhibition curves upon various treatments. Reproduced with
permission [60]. Copyright 2023, Wiley-VCH.
Fig. 3. (a) (I) Schematic illustration of BODIPY with the capability of enhanced ROS generation, tumor targetability, and renal clearance. (II) Relative tumor volume
of tumor-bearing mice in three groups. (III) Photographs of tumor tissues taken from the different groups of tumor-bearing mice. Reproduced with permission [61].
Copyright 2023, Wiley-VCH. (b) (I) The molecular structures and the types of aggregates formed by MBP and LMBP. (II) Mechanism of type I PDT treatment. (III)
Images of tumor tissues from different groups of tumor-bearing mice. (IV) Relative tumor volume growth profiles. Reproduced with permission [62]. Copyright 2023,
Wiley-VCH.
Fig. 4. (I) The chemical structure of Gal-OH-BDP and formation of Gal-OH-BDP NPs. (II) Galactose-targeting and (III) NIR-II fluorescence imaging-guided PTT. (IV)
Viabilities of HeLa (top) and HepG2 cells (bottom) by using Gal-OH-BDP NPs. (V) IR thermal images (left) and temperature curves of the tumors against time after
injection with PBS and Gal-OH-BDP NPs (right). (VI) Tumor volume changes of the mice in various groups with Gal-OH-BDP NPs. Reproduced with permission [64].
Copyright 2022, Elsevier.
Fig. 5. (a) (I) Self-assembled Bodiplatin-NPs for synergistic PDT/PTT. (II) Images of 4T1 cells stained by Lysotracker Green DND-26 and Hoechst 33,342 after
incubation with Bodiplatin-NPs. (III) Viability of 4T1 cells treated with Bodiplatin-NPs in the presence or absence of Vc. Reproduced with permission [65]. Copyright
2016, Wiley-VCH. (b) (I) Schematic illustration of self-assembly, tumor-targeted delivery and synergistic PDT/PTT mechanisms of 4-IBMs (Top); TEM imaging and
size distribution of 4-IBMs, self-assembly of 2-IB, 4-IB, and 8-IB (Bottom). (II) Viability of 4T1 tumor cells treated with 2-IBMs, 4-IBMs, and 8-IBMs. (III) Tumor
growth profiles of the mice treated with 2-IBMs, 4-IB, 4-IBMs, and 8-IBMs. **p < 0.01. Reproduced with permission [66]. Copyright 2021, Wiley-VCH.
Fig. 6. (I) Chemical structure of BSL. (II) Schematic representation of lactose-mediated endo-cytosis, intracellular BODIPY release triggered by GSH from NPs selfassembled
by BSL, and synergistic therapies of PDT and PTT. (III) Cell viabilities of HL7702, C2C12, HepG2, HepG2/ADR, and HeLa, in the presence of BSL NPs (top),
and Cell viabilities of HepG2, HepG2/ADR, and HeLa in the presence of BSL NPs under irradiation (bottom). (IV) Tumor volumes of BALB/C nude mice bearing
HepG2 tumors by injecting BSL NPs. *p < 0.05, **p < 0.01. Reproduced with permission [72]. Copyright 2021, Elsevier.
Fig. 7. (I) Structures of the building blocks and self-assembled triangular metallacycles. (II) Illustration of the cellular uptake of NPs prepared from triangular
metallacycles. (III) CLSM images of HeLa cells after incubation with the ligand and metallacycles (top: BODIPY ligand; middle: triangular metallacycles 1; bottom:
triangular metallacycles 2). (IV) Cytotoxicities of triangular metallacycle 2 and BODIPY ligand against HeLa cells. (V) Cytotoxicities of different formulations against
A2780cis cells. Reproduced with permission [93]. Copyright 2018, American Chemical Society.
Fig. 8. (a) (I) Structures of BODIPY ligand and the self-assembled triangular metallacycles. (II) Nanoencapsulation method of preparing NPs by using DSPE-PEGMAL.
(III) Cell viabilities of HEK293 cells (left) and U87 cells (right) after treatments. (IV) Variations of the tumor volume (left), gross appearance of the excised
tumors (middle) and body weight of mice during therapies (right). 2: metallacycle; 4: BODIPY ligand. Reproduced with permission [94]. Copyright 2022, National
Academy of Science.
Self-assembly of BODIPY-based metal-coordinated macrocycles
In recent years, a considerable number of studies on metal-coordinated BODIPY-based macrocycles for phototherapies have been reported [93], [94], [102], [103], [104], [105], [106], [107]. The use of metal-coordination driven self-assembly has proven to be an effective strategy for constructing various 2D or 3D supramolecular metal-coordination macrocycles with precisely defined sizes and shapes [31], [108], [109], [110], [111]. The integration of BODIPY units into these metal-coordinated
Fig. 9. (a) Molecular structures of RuA–RuD, and the anti-tumor mechanisms of RuD. Reproduced with permission [95]. Copyright 2023, Wiley-VCH. (b) Schematic
illustration of the synthesis of Ru1105 and the PDT in vivo. Reproduced with permission [96]. Copyright 2024, American Chemical Society.
Fig. 10. (I) The synthesis routes of M1 and Melanin-M1, cellular uptake and Pt(II) release of Melanin-M1. (II) Photothermal toxicity of cisplatin, M1 and Melanin-M1
on HeLa cells. (III) Tumor volume of mice treated with different formulations. ***p < 0.001, ****p < 0.0001. Reproduced with permission [97]. Copyright 2020,
Springer Nature.
Fig. 11. (a) The synthesis (I), anti-tumor mechanism (II), and in vivo application (III) of Ru1085. (IV) Tumor volume changes of tumor-bearing mice against time. (V)
Kaplan–Meier survival rates for various treated mice. Reproduced with permission [100]. Copyright 2022, Springer Nature. (b) (I) The preparation of Ru1100 and
NIR-II imaging guided tumor diagnosis and therapy. (II) Confocal images of A549 cells incubated with Ru1100 and JC-1 in the absence and presence of irradiation.
(III) Tumor growth inhibition after different treatments. Reproduced with permission [101]. Copyright 2022, the Royal Society of Chemistry.
Fig. 12. (I) Structure of 3d. (II) Changes in the absorption spectrum of DPBF in the presence of 3d for 1O2 characterization. (III) EPR spectra of 3d for O2
• characterization. (IV) The decay trace of triplet state of 3d. (V) Cell cytotoxicity of 3d micelles to HeLa cells demonstrated by CCK-8 assay. (VI) Images of acridine orange
(green channel, live cell marker) and propidium iodide (red channel, dead cell marker) co-stained HeLa cells incubated. Reproduced with permission [114].
Copyright 2021, the Royal Society of Chemistry.
Fig. 13. (a) (I) NIR-mediated PDT, Car-BDP-TNM construction and molecular structures of Car-BDP, PLA-PEG, and PLA-PEG-FA. Viabilities of 4T1 cells (II) and HeLa
cells (III) by Car-BDP-TNM-mediated PDT under different thickness tissue. (IV) Car-BDP-TNM-mediated PDT in deep tumor. (V) Tumor growth inhibition by Car-BDPTNM
mediated PDT in 4T1 tumors. Reproduced with permission [133]. Copyright 2016, American Chemical Society. (b) (I) The molecular structure of RET-BDP and
schematic illustration of PDT by RET-BDP-TNM. (II) Cell viabilities after treatments with RET-BDP-TNM and B2-TNM: HeLa cells (left), KP7B cells (middle), and 4T1
cells (right). (III) Photographs of the resected tumors of mice. Reproduced with permission [134]. Copyright 2017, Wiley-VCH.
Self-assembly of BODIPY-encapsulated polymers
Compared to inorganic or metallic NPs, which have raised significant concerns regarding their potential toxicity to biological tissues [122], [123], [124], encapsulating BODIPYs within polymer components has emerged as a prevalent strategy for PDT, PTT, or combined therapies of PDT and PTT. The resultant polymeric assemblies, which can be tailored in terms of composition, size, and surface properties, are generally non-toxic and degrade readily within organisms over time [7], [75], [125], [126]
Fig. 14. (I) Preparation and self-assembly of PPIAB NPs. (II) O2• photogeneration mechanism of PPIAB NPs and its application in hypoxic cancer therapy. (III)
fluorescence images of 4T1 tumor bearing mice after PPIAB NPs injection. (IV) Tumor volume changes against time. ***p < 0.001. (V) Photograph of tumor tissues
collected from mice with different treatment. Reproduced with permission [136]. Copyright 2020, Wiley-VCH.
Fig. 15. (I) Molecular structure of BDP-5. (II) Schematic illustration of the ISC processes, reduction of ΔES1–T1 for enhancing ISC and increasing 1O2 generation. (III)
Schematic illustration of the self-assembly of BDP-5 NPs. (IV) (left) Fluorescent images of HeLa tumor-bearing mice after injection of BDP-5 NPs or normal saline;
(right) tumor growth curves in HeLa tumor-bearing mice with injection of BDP-5 NPs (blue) or normal saline (black). (V) Cell viabilities of HeLa cells after treatments
with BDP-5 NPs. Reproduced with permission [140]. Copyright 2020, Wiley-VCH.
Fig. 16. (I) Molecular structures of helical-BDP and ordinary BDP (top) and the side view of the RHF optimized ground structures (bottom). (II) Cell viabilities of
CT26 cells treated with increasing concentrations of helical-BDP-NPs (left) and IRDye 700DX (right). (III) Schematic illustration of helical-BDP-NPs with anti-PD-L1
for tumor treatment. (IV) Primary (left) and artificial metastatic (right) tumor volume growth curves in tumor-bearing mice. Reproduced with permission [142].
Copyright 2020, Wiley-VCH.
Fig. 17. (a) (I) Top: self-assembly of AN-BDP and the intermolecular interaction mode in NPs. Bottom: the AN-BDP-contained NPs for PDT. (II) Cell viability of 4T1
cells treated with AN-BDP NPs. (III) Tumor volume changes of mice bearing tumors at different conditions. *p < 0.05, **p < 0.01, and ***p < 0.001. Reproduced with
permission [143]. Copyright 2021, Wiley-VCH. (b) Top: structure illustration of BDPTPA, BDPA, and ABDPTPA; Bottom: illustration of ABDPTPA NPs for 1O2
“afterglow” enhanced phototheranostics. Reproduced with permission [144]. Copyright 2021, Wiley-VCH. (c) The preparation of 1O2-nanotrap and its cytosolic
delivery for hypoxic PDT. Reproduced with permission [145]. Copyright 2022, Wiley-VCH.
Fig. 18. (I) The structure of α,β-linked BODIPYs, the process of generation of O2 • instead of 1O2, and the application for PDT in vivo. (II) The energy gaps of T1–S0 and
3O2–1O2. (III) Viabilities of HepG2 cells subjected to PS 2 with (left) or without (right) irradiation. Reproduced with permission [146]. Copyright 2021, Wiley-VCH.
Fig. 19. (I) Schematic illustrations of preparing water-stable nano-J-aggregates (J-NP). (II) The mechanism of PTT performance of J-NP. (III) Molecular structures
(BDP-H and BDP) and BDP J-dimer driven by duple Br–π interactions. (IV) UV–vis absorption spectra of BDP monomer in DMSO (blue) and J-NS NPs in water (red).
Reproduced with permission [169]. Copyright 2021, American Chemical Society.
Fig. 20. (a) (I) Constructing Nano-BFF and its PTT application. (II) 4T1 cells viabilities administrated with Nano-BFF. Without irradiation (top), under 808 (middle)
and 1064 nm (bottom) laser exposure. (III) Top: temperature variations at tumor site of the mice against time. Middle: relative tumor volumes in different treatment
groups. Bottom: survival rates of the mice bearing 4T1 tumors after different treatments. Reproduced with permission [170]. Copyright 2021, Springer Nature. (b)
Schematic illustration of Dye 2-contained J-aggregation NPs for NIR-II fluorescence imaging-guided PTT. Reproduced with permission [172]. Copyright 2022, the
Royal Society of Chemistry.
Fig. 21. (a) (I) Molecular structures of BDP1, BDP2, BisBDP1, and BisBDP2. (II) Schematic illustrations of the PA imaging–guided PTT by BisBDP2-contained Jaggregates.
(III) Temperature variations at tumor site of the mice against irradiation time. (IV) Relative fluorescence intensity in orthotopic liver tumor of the mice
with different treatments. Reproduced with permission [173]. Copyright 2022, American Association for the Advancement of Science. (b) (I) Schematic illustration of
strategic design of CT-coupled J-aggregates. (II) Cell viabilities of Hepa1-6 and HepG2 cells treated with BDP2-NPs. (III) Tumor growth curves of various groups
under different conditions. ****p < 0.0001. Reproduced with permission [178]. Copyright 2024, the Royal Society of Chemistry.
Fig. 22. (I) Protonation mechanism of NAB induced by pH changes. (II) Schematic illustration of the radiative and non-radiative transitions induced by pH changes.
(III) Tumor volume changes of different mouse groups. (**p < 0.01). (IV) Schematic illustration of pH-sensitive NAB-contained NPs for PAI and PTI guided synergistic
therapies of PDT and PTT. Reproduced with permission [180]. Copyright 2017, American Chemical Society.
Fig. 23. (a) (I) Schematic illustration of combined PDT and PTT using BODIPY-contained polymeric vesicles. Viabilities of 4T1 tumor cells treated with BODIPY
vesicles in the absence (II) or presence (III) of Vc. Reproduced with permission [186]. Copyright 2017, Wiley-VCH. (b) (I) Chemical structures of conjugated BODIPYs
and their formation of NPs. (II) Schematic illustration of photoconversion routes of CPs-based NPs. (III) Combined PDT and PTT by utilizing tri-BDP-NPs against
tumor cells. Viabilities of 4T1 tumor cells treated with di-BDP-NPs (IV) and tri-BDP-NPs (V). Reproduced with permission [187]. Copyright 2018, Wiley-VCH.
Fig. 24. (I) Schematic illustration of encapsulating BODIPY-Ir for constructing micelles. (II) Photophysical processes of generating 1O2 and photothermal conversion.
(III) Intracellular PDT/PTT treatments for cancer cells apoptosis. (IV) 1O2 quantum yields of Micelle-Ir, BODIPY-Ir and BODIPY-I by using DPBF as 1O2 scavenger. (V)
PCE of Micelle-Ir, BODIPY-Ir, and BODIPY-I. Reproduced with permission [188]. Copyright 2021, Wiley-VCH.
Fig. 25. (I) Schematic illustration of aromatic ring-fused aza-BODIPYs J-aggregates. (II) JBDP-a NPs used for combined PDT and PTT. (III) Survival rate of 4T1 cells
incubation with JBDP-a NPs or commercial IR-1061 at different concentrations. (IV) The tumor volume of various mice groups under different conditions. Reproduced
with permission [189]. Copyright 2024, Wiley-VCH.
Fig. 26. (I) Schematic illustration of the structures of PEG, BODIPY, and prodrug (PTX), the self-assembly and combination therapy processes of NPs with optimized
ratio. (II) Viabilities of cancer cells treated with Ada–BODIPY and Ada–PTX with various ratios. (III) Time-dependent tumor volumes of different mice with different
treatments. (IV) Tumor weights of mice with different treatments. (V) Body weights of the mice after different treatments. Reproduced with permission [198].
Copyright 2019, Wiley-VCH.
Fig. 27. (I) Representation of self-degradable BDP2IPh PS for PDT and chemical structure of BDP2IPh and CB[7]. (II) Decay traces of triplet states for BDP2IPh (left)
and BDP2IPh-CB[7] (right). (III) ADPA as the probe to monitor 1O2 generation abilities of BDP2IPh and BDP2IPh-CB[7]. (IV) MCF-7 cell viabilities with BDP2IPh and
BDP2IPh-CB[7] treatments in various conditions: in darkness (top left) and under light irradiation (top right); safety tests of BDP2IPh residues towards BEAS-2B cells
after PDT: in darkness (bottom left) and under irradiation (bottom right). Reproduced with permission [201]. Copyright 2020, Wiley-VCH.
Self-assembly of BODIPYs via host–guest interactions
Supramolecular host–guest chemistry has gained significant prominence since the Nobel Prize in Chemistry was awarded in 1987 to Pedersen, Cram, and Lehn [194]. Herein, we introduce three primary macrocyclic hosts: cyclodextrin (CD) [195], [196], [197], [198], cucurbituril (CB) [199], [200], [201], [202], [203], and pillar[n]arene [204], [205], [206], [207], [208], subsequently summarize how these macrocycles form supramolecular assemblies with BODIPYs to enhance their PDT and PTT performances.
Fig. 28. (I) Schematic illustration of the fabrication of host–guest complexes (HG) and generation of ROS. (II) Viabilities of HeLa cells subjected to a range of HG
concentrations without (top) and with (bottom) light-irradiation. Reproduced with permission [207]. Copyright 2022, the Royal Society of Chemistry.
Fig. 29. (I) Schematic illustrations of chemical structures, cartoon representations of P5, BDMI, MI, and CDDP, the preparation of CDDP@Suprasomes,
CDDP@Liposomes, and their anti-tumor process in vivo. (II) The concentration-dependent photothermal effect of suprasomes. (III) 4T1 cells viabilities after different
treatments. (IV) Tumor volume changes of the mice with different treatments. **p < 0.01. Reproduced with permission [209]. Copyright 2022, Wiley-VCH.
Fig. 30. (I) Schematic illustrations of the preparation and anti-tumor mechanism of LacP5⊃BSTA@DSF. (II) The images of living mice after injection of LacP5⊃BSTA. (III) Tumor sizes after treatment. (IV) Tumor volume changes during treatment. Reproduced with permission [210]. Copyright 2023, the Royal Society of Chemistry.
Conclusion and outlook
In this review, we have summarized various supramolecular assembly strategies for constructing BODIPY-based assemblies aimed at enhancing their performance in single or synergistic therapies involving PDT and PTT. The primary structures of these assemblies were constructed by amphiphilic BODIPYs, BODIPY-based metal-coordinated macrocycles, heavy-atom-free cyclic BODIPY arrays, BODIPYencapsulated polymers, and BODIPY-based host–guest complexes. Significant advancements have been made in recent years toward enhancing the PDT and PTT capabilities of BODIPYs through supramolecular assembly. This includes improved water solubility, biocompatibility, and penetration depth into tumor tissues via red-shifted NIR absorption. BODIPY-based NPs have demonstrated selective uptake by tumor cells through the EPR effect. Moreover, many NPs possess targeted therapeutic capabilities, which have amplified their therapeutic efficacy. Effective generation of ROS and heat, pivotal for inducing cancer cell death, has been achieved by modulating the intermolecular interactions within BODIPY assemblies. Additionally, several BODIPYs have been structured for synergistic therapies, addressing the limitations associated with singular PDT or PTT treatments. Consequently, BODIPYbased assemblies summarized in this review exhibited great potential for various anti-tumor phototherapies.
Despite these advancements, several challenges still pose significant hurdles for the clinical application of BODIPY-based supramolecular assemblies:
phototherapy should possess high-targeting performance, excellent water solubility and biocompatibility, robust penetration abilities, efficient tumor accumulation via EPR effects, and high ROS or heat generation capabilities. Additionally, they should be stable, not prone to leakage, and should be easily manufactured without complicated synthesis processes. Although challenges persist in the research of their supramolecular assemblies for PDT and PTT, the potential for improvement through strategic design and rational assembly is immense. As research progresses, we envision BODIPY-based assemblies becoming increasingly sophisticated and playing a vital role in antitumor treatments.
In Situ Visualizing Carboxylesterase Activity in Type 2 Diabetes Mellitus Using an Activatable Endoplasmic Reticulum Targetable Proximity Labeling Far-Red Fluorescent Probe
Ningge Xu【胥宁格】,Dandan Tang【唐丹丹】,Heng Liu*【刘恒】,Mengyue Liu【刘梦月】,Zheng Wen【文正】,Tongmeng Jiang【蒋童蒙】*, and Fabiao Yu【于法标】*
Cite this: Anal. Chem. 2024, 96, 26, 10724–10731
Publication Date:June 19, 2024
https://doi.org/10.1021/acs.analchem.4c01721
1Department of Radiotherapy, The First Affiliated Hospital of Hainan Medical University, Hainan Medical University, Haikou, 570102, China
2Key Laboratory of Hainan Trauma and Disaster Rescue, Key Laboratory of Emergency and Trauma, Ministry of Education, Engineering Research Center for Hainan Bio-Smart Materials and Bio-Medical Devices, College of Emergency and Trauma, Hainan Medical University, Haikou 571199, China
羧酸酯酶(CE)是一种在生物体中普遍存在的酶,它参与多种关键的生理和病理过程。肝脏中CE水平的变化可能作为II型糖尿病(T2DM)的重要预兆。近期,海南医科大学于法标教授课题组报道了II型糖尿病中羧酸酯酶活性检测,相关成果以“In Situ Visualizing Carboxylesterase Activity in Type 2 Diabetes Mellitus Using an Activatable Endoplasmic Reticulum Targetable Proximity Labeling Far-Red Fluorescent Probe”为题发表在国际化学权威杂志Analytical Chemistry上(DOI: 10.1021/acs.analchem.4c01721)。
Carboxylesterase (CE), an enzyme widely present in organisms, is involved in various physiological and pathological processes. Changes in the levels of CEs in the liver may predict the presence of type 2 diabetes mellitus (T2DM). Here, a novel dicyanoisophorone (DCI)-based proximity-labeled far-red fluorescent probe DCI2F-Ac with endoplasmic reticulum targeting was proposed for real-time monitoring and imaging of the CEs activity. DCI2F-Ac featured very low cytotoxicity and biotoxicity and was highly selective and sensitive for CEs. Compared with traditional CEs probes, DCI2F-Ac was covalently anchored directly to CEs, thus effectively reducing the loss of in situ fluorescent signals due to diffusion. Through the “on–off” fluorescence signal readout, DCI2F-Ac was able to distinguish cell lines and screen for CEs inhibitors. In terms of endoplasmic reticulum (ER) stress, it was found that thapsigargin (Tg) induced upregulation of CEs levels but not tunicamycin (Tm), which was related to the calcium homeostasis of the ER. DCI2F-Ac could efficiently detect downregulated CEs in the livers of T2DM, and the therapeutic efficacy of metformin, acarbose, and a combination of these two drugs was assessed by tracking the fluctuation of CEs levels. The results showed that combining metformin and acarbose could restore CEs levels to near-normal levels with the best antidiabetic effect. Thus, the DCI2F-Ac probe provides a great opportunity to explore the untapped potential of CEs in liver metabolic disorders and drug efficacy assessment.
Scheme 1. (a) Schematic illustration of dual sensing and labeling NIRF probe DCI2F-OTf for ONOO–. (b) Synthesis of NIRF probe DCI2F-OTf.
Figure 1. Fluorescence response of DCI2F-OTf (10 μM) to ONOO– excited at 490 nm. (a) Visualization of the fluorescence changes of DCI2F-OTf during titration with increasing ONOO– (0 – 35 μM) concentrations. (b) Linearity of the fluorescence intensity value of DCI2F-OTf at 652 nm with varied concentrations of ONOO– (5 – 35 μM). (c) Time-dependent fluorescence response of DCI2F-OTf before and after the addition of ONOO– (70 μM) at 37 °C recorded every 5 min. (d) The fluorescence intensities at 652 nm of DCI2F-OTf in the absence or presence of ONOO– (70 μM) over pH range from 3.0 to 7.0. (e) Values of fluorescence intensities of DCI2F-OTf treated with different competitive biological agents: 1. blank, 2. Na+ (500 μM), 3. K+ (500 μM), 4. Ser (200 μM), 5. Leu (200 μM), 6. Arg (200 μM), 7. S2O32- (100 μM), 8. HSO3– (100 μM), 9. H2S (100 μM), 10. Cys (100 μM), 11. GSH (1 mM), 12. NO2– (100 μM), 13. NO3– (100 μM), 14. NO (100 μM), 15. •OH (100 μM), 16. O21 (100 μM), 17. H2O2 (100 μM), 18. O2•– (100 μM), 19. HOCl (100 μM), 20. ONOO– (70 μM). (f) SDS-PAGE analysis of BSA (5 mg/mL) after incubation with DCI2F-OTf + ONOO–, DCI2F-OTf, DCI2F-OTf + ONOO– + UAin PBS at 37 ℃ for 30 min. Left: Coomassie brilliant blue staining; right: fluorescence imaging. λex/λem = 490/650 nm.
Figure 2. (a) RAW264.7 cells were pretreated with SIN-1 (200 μM, 30 min) or stimulated with LPS (1.0 μg/mL), IFN-γ (100 ng/mL) for 12 h, PMA (10 nM) for 30 min, and then incubated with DCI-OTf (10 μM, 30 min) or DCI2F-OTf (10 μM, 30 min), respectively. The red channel was collected in the range of 600-700 nm (λex = 488 nm) and the Hoechst channel was collected in the range of 430-480 nm (λex = 405 nm). (b) A549 cells were pretreated with SIN-1 (200 μM, 30 min), followed by incubation with DCI2F-OTf (10 μM, 30 min) or DCM-KA (10 μM, 30 min), before or after washout with fresh DMEM (three times, each for 6 min). (c) Normalized fluorescence intensity plots of DCI2F-OTf and DCM-KA labeled cells in (b) (n = 3). Scale bar: 50 μm.
Figure 3. (a) RAW264.7 cells pretreated with different concentrations of SIN-1 (0, 50, 100, 200 μM), SIN-1 (200 μM) plus ebselen (200 μM) for 30 min were incubated with DCI2F-OTf (10 μM) for 30 min. (b) The pixel intensity of DCI2F-OTf labeled cells in (a). (c) The protein levels of iNOS and IL-6 were detected by western blot analysis. (d) The relative protein expression level of iNOS and IL-6 in (c). (e) RAW264.7 cells were pretreated with SIN-1 (200 μM, 30 min), and then incubated with DCI2F-OTf (10 μM) for 0 – 30 min. (f) Flow cytometry analysis of DCI2F-OTf (10 μM) labeled SIN-1 (200 μM, 30 min) pretreated cells. Error bars represent s.d., n=3. Scale bar: 50 μm.
Figure 4. (a) RAW264.7 cells were pretreated with the stimulus LPS (1.0 μg/mL)/IFN-γ (100 ng/mL) for different periods (0, 3, 6, 12 h), PMA (10 nM) for 30 min or LPS (1.0 μg/mL)/IFN-γ (100 ng/mL) plus UA (200 μM) for 12 h, PMA (10 nM) for 30 min, and then incubated with DCI2F-OTf (10 μM) for 30 min. (b) RAW264.7 cells were pretreated with LPS (0, 0.25, 0.5, 1.0 μg/mL)/IFN-γ (100 ng/mL), PMA (10 nM), or LPS (1.0 μg/mL)/IFN-γ (100 ng/mL) plus AG (1 mM) for 12 h, PMA (10 nM) for 30 min, and then incubated with -OTf (10 μM) for 30 min. (c) The pixel intensity of DCI2F-OTf labeled cells in (a). (d) The protein levels of iNOS, IL-6, and NF-𝜅B were detected by western blot analysis. (e) The relative protein expression level of iNOS, IL-6, and NF-𝜅B in (c). (f) The pixel intensity of DCI2F-OTf labeled cells in (b). Error bars represent s.d., n=3. Scale bar: 50 μm.
Figure 5. (a) NIRF images of control and LPS-stimulated mice after intravenous administration of DCI2F-OTf (200 μM, 45 μL). (b) NIRF imaging and photographs of dissected major organs (1: heart, 2: kidney, 3: liver, 4: spleen, 5: lung) from mice in panel (a). (c) The histogram presents the average radiant efficiency of mice in panel (a). (d) The histogram presents the average radiant efficiency of the lung in panel (b). (e) H&E staining histological images for lung tissue in control and LPS-stimulated mice. Scale bar: 50 μm. (f-h) Serum levels of inflammatory factors TNF-α, IL-6, and IL-1β in control and LPS-stimulated mice. (i) The protein levels of iNOS, COX-2, NF-κB, and IL-6 were detected by western blot analysis. (j-n) The relative protein expression level of iNOS, COX-2, NF-κB, and IL-6 in (i). (o-p) Sections of lung tissue were immunostained with an antibody that detected 3-NT. Scale bar: 50 μm. (q) NIRF images of mice fresh lung tissue sections from ALI mice in the LPS6 group. The confocal Z-axis scan images at 0, 5, 10, 15, 20, 25, 30, 35, 40, 45, and 50 µm penetration depths. λex = 488 nm; red channel: λem = 600 – 700 nm.
Conclusion
In conclusion, we have designed a novel NIRF probe, DCI2F-OTf, for fluorescence imaging ONOO– in live cells and mice model of ALI. Under physiological conditions, DCI2F-OTf was highly sensitive and selective for ONOO– and yielded a linear response to ONOO over a wide concentration range from 0 to 70 μM. The QM covalently labeled neighboring proteins released from the reaction of DCI2F-OTf with ONOO– could solve the problem of intracellular diffusion of the probe, enabling precise imaging of intracellular ONOO–. This strategy was superior to the vast majority of ONOO– probes that have been developed so far. The excellent sensing performance and NIRF emission characteristics enable DCI2F-OTf to image ONOO– levels in mice and tissues with ALI. In vivo imaging results indicated that SFN significantly down-regulated the oxidative stress level, thereby attenuating the severity of LPS-induced ALI, and could exert a protective role against ALI. Therefore, DCI2F-OTf was a valuable tool for studying the physiological function of ONOO– and was expected to facilitate the understanding of oxidative stress diseases such as ALI and the rapid screening of corresponding therapeutic drugs.
5月23日,急诊创伤学院于法标教授团队在 《Chemistry of Materials》在线发表题为“Rational Design of Efficient Heavy-Atom-Free Boron-Dipyrromethene Nanophotosensitizers for Two-Photon Excited Photodynamic Therapy of Cancer”的论文。
Although boron-dipyrromethene (BODIPY) dyes have been widely recognized for their potential use as photosensitizers (PSs) in cancer treatment, the development of heavy-atom-free BODIPY PSs for photodynamic therapy (PDT), particularly in two-photon excited photodynamic therapy (2PE–PDT), remains challenging. Herein, a novel heavy-atom-free photosensitizer (BDP-6) with optimized singlet–triplet energy gap and steric hindrance was designed and synthesized to facilitate intersystem crossing and improve fluorescence intensity. To enhance the biocompatibility and tumor-targeting ability of BDP-6, corresponding nanophotosensitizers (BDP-6 NPs) were prepared by encapsulating BDP-6 within DSPE-PEG(2000) biotin. Compared to control BDP-5 NPs without dimethyl groups, BDP-6 NPs exhibited brighter deep red fluorescence and higher efficiency in generating reactive oxygen species (ROS) under one-photon excitation in aqueous solutions. Moreover, BDP-6 NPs displayed excellent tumor-targeting ability, bright red emission, and considerable phototoxicity with low dark toxicity toward cancer cells. Notably, under two-photon excitation, the BDP-6 NPs efficiently generated ROS both in aqueous solutions and living cells, thereby demonstrating exceptional performance in 2PE–PDT for cancer cell ablation. Furthermore, in vivo experiments revealed that BDP-6 NPs hold great promise for cancer PDT. Our work presents practical strategies for developing tumor-targeting heavy-atom-free nanophotosensitizers based on BODIPY dye for 2PE–PDT of cancer.
Figure 1. (a) Chemical structures and synthetic route of BDP dyes. (i) 4-bromo-2,6-dimethylbenzaldehyde, Pd(OAc)2, t-Bu3PHBF4 and K2CO3, toluene, reflux. (ii) DMF, POCl3. (iii) 2,4-dimethypyrrole, trifluoroacetic acid (TFA), p-chloranil, Et3N, and BF3.OEt2, CH2Cl2. (b) Schematic illustration for the preparation of BDP-6 NPs. (c) Nanoparticle size distribution of BDP PSs detected by DLS and TEM images (inset) of BDP-6 NPs. (d) UV-vis absorption and PL spectra of the BDP-5 NPs and BDP-6 NPs (10 µM, in water,lex = 490 nm). (e) ROS generation of BDP-5 NPs and BDP-6 NPs in water after irradiation by a green LED (20 mW/cm2) using DCFH-DA as ROS probe (lex = 500 nm, lem = 525 nm). (f, g) Two-photon ROS generation efficiency of BDP-6 NPs (10 µM). (f) A plot of fluorescence intensity of DHR123 (2.5 µM) with BDP-6 NPs according to the two-photon excitation wavelength. (g) A plot of fluorescence intensity for DHR123 with BDP-6 NPs against TP irradiation time at 780 nm (lex = 500 nm,lem = 525 nm).
Figure 2. Fluorescence microscope images of (a) HeLa (cancer cells) and WI38 (normal cells) cells after treatment with BDP-6 NPs (5 µM) and (b) loaded with DCFH-DA (total ROS probe) or PI (4 µM, dead cell marker).(c) Cell viability of HeLa cells after treatment with different concentrations of BDP-6 NPs with green light irradiation.
Figure 3. Fluorescence microscopy image of HeLa cells stained with BDP-6 NPs(5 µM) and (a)DCFH-DA (20 μM, ROS probe) or (b) Hoechst 33342/PI as indicators (2 µM/ 10 µM) followed by TP scans at 5.0 mW laser power. Scale bars = 50 µm. (c) Viability of cells incubated with BDP-6 NPs and irradiated at 780 nm at individual laser powers of 1.5, 2.4, 5.0, and 6.3 mW. (d) Cell viability estimated after 780 nm TP irradiation (6.3 mW).
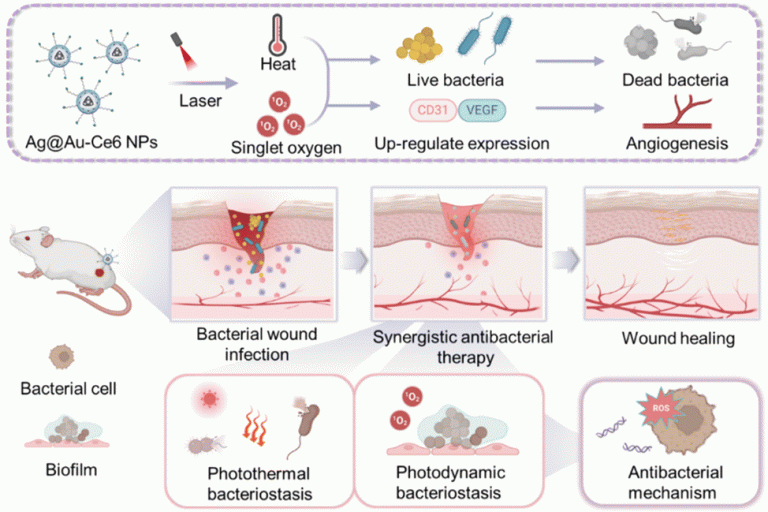
Figure 4. 3D image of HeLa spheroid ROS generation using ROS indicator DHR123. (a), (b) 3D images of HeLa spheroids incubated with DHR123 (15 µM) and BDP-6 NPs (100 µM) for 1 hour. (c), (d) Fluorescence images of HeLa spheroids incubated with DHR123 (15 µM) and BDP-6 NPs (100 µM) after 400 TP irradiation scans. Images were recorded in the 500-550 nm emission window after excitation at 488 nm. Scale bar = 50μm.
Figure 5. (a) In vivo imaging of BDP-6 NPs (intravenous injection, 10 μM, 100 μL in saline) in female nude BALB/c mice (λex = 490 nm, λem = 500-575 nm) at different time points of 0, 0.5, 1, 2, 4, 8, 12 h. (b) Visualization of BDP-6 NPs in the mouse breast cancer model. Photographs of untreated and PDT-treated mice models (660 nm, 200 mW/cm2, 15 min) for 1-15 days. The changes in tumor volume and weight. (c) Photographs of untreated and PDT-treated tumors within 15 days. (d) The analysis of tumor volume. (e) 2D ex vivo imaging in separated organs (tumor, heart, liver, spleen, lung, and kidney) sacrificed from mice models.
Figure 6. H&E staining of separated organs (heart, liver, spleen, lung, and kidney) sacrificed from untreated and PDT-treated mice models.
3. CONCLUSIONS
A novel heavy-atom-free BODIPY PSs (BDP-6) comprised of an electron-donating PXZ group and an electron-withdrawing BODIPY core was designed and synthesized for tumor-targeted two-photon photodynamic therapy. The photostable and biocompatible BDP-6 NPs were produced by encapsulating BDP-6 within DSPE-PEG(2000) biotin. Compared to BDP-5 NPs without dimethyl groups, BDP-6 NPs showed brighter emission in the deep red region and more efficient ROS production efficiency under one-photon excitation in aqueous solutions. The BDP-6 NPs could selectively accumulate in cancer cells and effectively kill cancer cells by generating intracellular ROS under green light illumination (one-photon) with low dark toxicity. Interestingly, upon two-photon excitation, the BDP-6 NPs efficiently generated ROS in both aqueous solution and living cells and consequently exhibited excellent 2PE-PDT performance toward cancer cells. In vivo, results demonstrated that BDP-6 NPs showed great potential for tumor-targeted fluorescence imaging and PDT treatment. This work provides a facile, straightforward methodology for developing highly efficient nanophotosensitizers for two-photon excited photodynamic therapy based on heavy-atom-free BODIPY platforms.
Imaging and tracking of tumor extracellular vesicles to unravel the progression of ovarian carcinoma using fluorescent membrane probes
a
Key Laboratory of Hainan Trauma and Disaster Rescue, The First Affiliated Hospital of Hainan Medical University, Hainan Medical University, Haikou 571199, China
b
Engineering Research Center for Hainan Bio-Smart Materials and Bio-Medical Devices, Key Laboratory of Emergency and Trauma, Ministry of Education, Key Laboratory of Hainan Functional Materials and Molecular Imaging, College of Emergency and Trauma, Hainan Medical University, Haikou 571199, China
Both lipid membrane probe and genetically encoding method allow for stable and specific staining of EVs.
Ovarian cancer EVs are rapidly internalized by various cells in vitro.
Visualizing and tracking of tumor EVs in vivo using fluorescence and ultrasonic imaging.
In vivo biodistribution reveals the main metabolization organs of liver and kidney.
First visualized evidence of tumor EVs in promoting ovarian tumor progression.
Abstract
Tumor extracellular vesicles (EVs) exert vital role in mediating intercellular communication. Investigation on the function of EVs will contribute to understanding of EV pathophysiology in cancer development. However, direct visualizing the behavior of EVs in vivo still faces challenges. In this study, we develop fluorescently labelled EVs derived from ovarian carcinoma (OC-EVs) utilizing lipid dye and protein-based membrane probes, which are investigated in living cells and mice models by high-resolution fluorescence imaging and ultrasonic imaging. Both membrane probes exhibit high labelling efficiency of EVs and good compatibility in vivo. The rapid internalization of individual OC-EVs by different single living cells are monitored, together with the complex and bidirectional exchange of EVs between normal and cancer cells. Furthermore, the enrichment of OC-EVs in ovary is recorded, indicating the homing targeting capability of EVs. For more precise observation of the homing process, in vivo ultrasonic imaging and fluorescence imaging are performed to evaluate the rapidly growing ovarian tumor after administrating OC-EVs. The results show that OC-EVs can accelerate tumor growth and promote the metastasis of primary tumors in mice, which provides valuable information in understanding the development of ovarian carcinoma and pursuing potential solution for improved treatment.
Extracellular vesicles (EVs) are lipid bilayer vesicles that are secreted into the extracellular environment by all known organisms [1], [2]. EVs have been extensively investigated owing to the vital role in transporting bioactive cargos and mediating the intercellular communication to regulate various biological processes [3], [4], [5], [6]. Therefore, knowledge of EV biology and application has gained wide interest and grown rapidly [7], [8], [9], [10]. Typically, EVs have been employed as potential targets to study the mechanism of cargo transport of cancer cells and their influence on tumor development [11], [12]. However, investigation on EVs’ function faces challenges, for instance, lack of powerful live imaging tools, efficient labelling strategies or suitable animal models [13], [14], [15]. In addition, EVs preserve heterogeneity due to complex biogenesis, which put hurdles in EV biology and pathology research including cancer [16], [17], [18].
Recent years, it has been reported that a multitude of noninvasive imaging methods has been investigated to explore the spatio-temporal dynamics of nanoparticles in vitro and in vivo[19], [20], [21], by combining with advanced labeling strategies [22], [23]. For instance, fluorescently labelled EVs have been visualized at cellular level or in vivo[24], [25], using lipid membrane dyes such as PKH67, DiR [26], Membright dyes [14], or using fluorescent EVs secreted from genetically encoded cells [15], [27], [28]. However, the visualized tracking EVs biodistribution and the assessment on EVs’ function in tumor development has only been sparsely investigated due to the above-mentioned challenges, which limits the insights into EVs pathophysiology, especially in single vesicle level [29].
Among the various cancer types, ovarian carcinoma is the gynecologic malignancy with the highest case-to-fatality ratio, putting threaten on female health worldwide [30]. It has been reported that EVs exert crucial function in shuttle molecules to receipt cells and influence cancer development [11], [31]. In particular, the homing targeting ability of EVs contributes to cancer growth and metastases [32]. However, there is still a lack of direct evidence on the function of ovarian cancer EVs in affecting tumor progression.
Herein, we employ two labelling strategies to obtain fluorescently labelled ovarian cancer derived EVs (OC-EVs) for exploring their role in the development of ovarian carcinoma (Scheme 1). In one aspect, lipid membrane probes including PKH67 and Mem560 (short for MemGlow560) are used to stain EVs, which exhibit high labelling efficiency and compatibility. In another aspect, EVs with fluorescent protein membrane labels are obtained from genetically encoding cells. Based on the two kinds of fluorescent EVs, the interaction of single EVs with individual cells, as well as the bi-directional EV exchange between normal ovarian cells and ovarian cancer cells are recorded, providing in vitro evidence of the homing potential of EVs to homologous cells. In vivo monitoring the distribution of EVs unveil the hepatic-leading metabolism process. Meanwhile, the enrichment of EVs in brain suggests the capability of EVs in crossing brain-blood-barrier (BBB) and the accumulation in ovary also demonstrated the homing ability of OC-EVs. Finally, by applying genetically modified OC-EVs to in situ ovarian tumor-bearing mice, the rapid growth of tumor is monitored and recorded with fluorescence and ultrasonic imaging techniques, which evidently demonstrate the homing ability of EVs in accelerating tumor growth. Altogether, based on lipid and fluorescent protein membrane probes, we successfully demonstrate the function of tumor EVs in promoting ovarian cancer, thereby offering valuable information for addressing other open questions in EV biology and promoting the development of EV therapeutics.
Scheme 1. Schematic illustration of imaging and tracking of tumor extracellular vesicles to unravel the progression of ovarian carcinoma using fluorescent membrane probes.
Fig. 1. Characterization of the OC-EVs before and after fluorescent dye labelling. (a) Molecular structure of the membrane binding probe MemBright. (b) TEM of OC-EVs, OC-EVs-Mem560 and OC-EVs-PKH67. Enlarged images of single EVs displayed in the bottom showed the respective boxed area of images in the top. Scale bars, 100 nm. (c) Western blot analysis of EVs with anti-CD63, anti-TSG101, anti-EpCAM, using GAPDH as loading control. (d) NTA results of i) OC-EVs ii) OC-EVs-Mem560 (average diameter of 155.7 nm with peak diameter of 129.5 nm) and iii) OC-EVs-PKH67 (average diameter of 153.7 nm and peak diameter of 144.6 nm) showing the concentration (y axis) and diameter (x axis).
Fig. 2. (a) Schematic diagram of cell membrane labelling with GFP (HO23 cells, top) or mCherry (EpCAM overexpression, OVCAR3 cells, bottom) and the secretion of transfected EVs. (b) Live cell confocal fluorescence imaging of i) HO23-GFP cells and ii) OVCAR3-mCherry cells, the enlarged images of boxes area and the 3D imaging of cells. Scale bars, 5 μm. (c) NTA results of EVs derived from i) HO23 cells ii) HO23-GFP cells and iii) OVCAR3-mCherry cells. (d) TEM of HO23-EVs, HO23-EVs-GFP and OC-EVs-mCherry. Scale bars, 100 nm. (e) Western blot analysis of three types of EVs using CD63, TSG101 and EpCAM antibodies, using GAPDH as loading control.
Fig. 3. (a) Fluorescence imaging of macrophages (RAW264.7) cocultured with OC-EVs-PKH67. Figures show the blue, green, merge channels and figure inset of individual cells. (b) Fluorescence imaging of OC-EVs-PKH67 internalized in macrophages at different time and the quantitative result. (c) Dynamic tracking of the interaction between macrophage-Mem560 and OC-EVs-PKH67. (d) The XZ and YZ display of 3D imaging of the cell in Fig. c. Time-dependent fluorescence imaging of the interaction between (e) Macrophage-GFP and OC-EVs-Mem560 (f)-(g) showed interaction of OC-EVs-PKH67 with neutrophil-Mem560, HO23-Mem560 and OVCAR3-Mem560. (i) Comparison of different internalization time of OC-EVs by various cells. Scale bars, 5 μm.
The following is the Supplementary material related to this article Movie S1 -S5.
Fig. 4. (a) Schematic illustration of co-incubation of OVCAR3-mCherry cells and HO23-GFP cells. Time-lapsed confocal imaging of (b) OVCAR3-mCherry cells and (c) HO23-GFP cells. Scale bars, 5 μm. (d) Time-lapsed imaging of the internalization of OC-EVs-mCherry by a HO23-GFP cell within 84 s with time interval of 12 s. Scale bars, 5 μm. (e) Live-cell imaging of EVs exchange and uptake between OVCAR3-mCherry and HO23-GFP cells. Magnification of boxes in merged panels are shown in enlarged images. i) EVs released from two cell lines were observed in surrounding regions (while and yellow arrowhead). ii) EVs secreted from HO23-GFP cell were observed inside the OVCAR3-mCherry cell (yellow arrowhead). iii) EVs secreted from OVCAR3-mCherry cell were found inside the HO23-GFP cell (white arrowhead). Scale bars, 20 μm. (f) and (g) The 3D imaging of OVCAR3-mCherry cell and internalized HO23-EVs-GFP, and HO23-GFP cell with captured OC-EVs-mCherry.
Fig. 5. In vivo and ex vivo imaging of OC-EVs. (a) Bioimaging plan after using i) OC-EVs-Mem560 and ii) OC-EVs-mCherry via I. P. or I. V. injection. (b) Ex vivo fluorescence (FL) imaging of organs (brain, lung, heart, liver, kidney, spleen and ovary) harvested from the mice treated with i) Mem560 dye and ii) OC-EVs-Mem560, I. P. injection. iii) Mem560 dye and iv) OC-EVs-Mem560, I. V. injection. (c) and (d) are quantification results of images displayed in Fig. b ii) and iv), analyzed by recording the photons/second/steradian (ph/s/sr) of each organ and normalized to that of the injected dose based on the fluorescence intensity. Data shown as mean (n = 3). (e) Ex vivo imaging of main organs harvested from the mice treated with OC-EVs-mCherry via i) I. P. injection or ii) I. V. injection. (f) and (g) quantification of imaging results displayed in Fig. e. Data shown as mean (n = 3).
Fig. 6. Investigation on the function of OC-EVs on tumor progression in mice models. (a) Schematic illustration of the experimental plan. (b) Photographs of the representative mice of the control (day 0), model (day 0), PBS (day 14) and OC-EVs-mCherry (day 14) groups. (c) Ultrasonic imaging of the mice displayed in Fig. b, images showed left (L) and right (R) ovaries from coronal, transverse views, and the blood signal. Scale bars, 1 mm. (d) Photographs of the reproductive system of the mice in Fig. b. The size of left ovary was measured by a vernier caliper. (e) H&E-stained slices of the brain, liver and ovary of the mice in Fig. b. Scale bars, 50 μm. (f) Ovarian volumes (mm3) of the left (L) and right (R) ovaries of the mice treated with PBS and OC-EVs-mCherry, measured by ultrasonic imaging (day1-day 11) and vernier caliper (day 14). (g) Ovarian tumor growth speed calculated from Fig. f and displayed in mm3/d. (h) Photographs (left) and fluorescence imaging (right) of organs harvested from the mice treated with PBS and OC-EVs-mCherry.
Conclusions
In this study, we employed two types of membrane probes to obtain fluorescently labelled EVs and successfully visualized OC-EVs in vitro and in vivo. Based on the direct labeling of EVs by lipophilic membrane probes (PKH67 and Mem560), we recorded the single vesicle internalization by various cells (including macrophage, neutrophil, ovarian cell and ovarian cancer cell). Using indirect labeling of vesicles by harvesting EVs from lentivirus (GFP and EpCAM:mCherry) transfected cells, we observed the one-way delivery and bidirectional exchange of EVs between normal ovarian cells and cancer cells. These data indicated the liability of cancer EVs to interact with cells of the same origin, mainly attributing to the homing characteristics of EVs. By administrating fluorescently labelled OC-EVs into mice models, the hepatic and renal clearance process, as well as the homing effect of EVs were unveiled. Furthermore, by injecting OC-EVs into xenotransplanted ovarian tumor bearing nude mice, the function of OC-EVs in promoting tumor growth was verified. In general, our findings supported the EV-mediated intercellular communication, which were complex, multi-directional, far-reaching, and homing. We also confirmed the metabolism routes of EVs in vivo and the essential function of EVs in accelerating tumor development. Future studies would focus on the underling molecular mechanism dominated in EVs influence on tumor progression, which would provide potential targets for tumor treatment.
Organic dye-based photosensitizers for fluorescence imaging-guided cancer phototheranostics
a
Key Laboratory of Hainan Trauma and Disaster Rescue, Key Laboratory of Haikou Trauma, The First Affiliated Hospital of Hainan Medical University, Hainan Medical University, Haikou 571199, China
b
Engineering Research Center for Hainan Bio-Smart Materials and Bio-Medical Devices, Key Laboratory of Emergency and Trauma, Ministry of Education, Key Laboratory of Hainan Functional Materials and Molecular Imaging, College of Emergency and Trauma, Hainan Medical University, Haikou 571199, China
Received 2 January 2024, Revised 6 March 2024, Accepted 5 April 2024, Available online 2 May 2024, Version of Record 2 May 2024
Four types of photosensitizers with fluorescence imaging functions were summarized.
Design strategies for fluorescence-imaging guided phototherapy were highlighted.
Challenges and future opportunities of imaging-guided phototherapy were presented.
Abstract
Precise diagnosis and treatment of tumors is the current hotspot, which has also given rise to a new subject named “theranostics”. It is an ideal precision treatment strategy if the agent can provide effective treatment while visually monitoring tumor occurrence and providing timely feedback on the efficacy. Fluorescence imaging-guided phototherapy technology is a non-invasive, simple-to-operate, highly safe and non-drug-resistant visual treatment method that can accurately monitor tumor sites, perform efficient phototherapy and feedback on tumor treatment effects. Photosensitizers with fluorescence imaging capabilities play a decisive role in the entire diagnosis and treatment process. In this review, we focus on four commonly used photosensitizers with fluorescence imaging functions, including cyanine, tetrapyrrole structures, BODIPY, and AIEgens. The design strategies and principles for improving imaging or/and therapeutic functions were highlighted based on these four organic molecular monomers or their nanoaggregates, nanocomposites, etc. The challenges and future opportunities of fluorescence imaging-guided phototherapy in the clinical translation of precision tumor treatment are also presented.
Tumors have the characteristics of high incidence rate, strong concealment in the early stage, complexity and heterogeneity of the occurrence and development process, as well as easy recurrence and metastasis, making them a killer that seriously reduces the quality of life and endangers life and health [1], [2], [3]. Traditional single or combined treatment methods such as surgery, chemotherapy, and radiotherapy are still the conventional means of clinical treatment of tumors [4], [5]. Frustratingly, the above-mentioned treatments still face shortcomings such as high invasiveness, low targeting, and high side effects [6], [7]. They are also unable to achieve real-time visual diagnosis of tumors and timely feedback on therapeutic effects. Therefore, the development of new imaging-guided, non-invasive and low-side-effect theranostic methods is of great significance for the precise treatment of tumors [8], [9], [10].
The non-invasive, highly selective, and low-drug-resistant phototherapy has attracted widespread attention from medical workers and scientific researchers since it was used in the clinical treatment of various types of tumors more than 40 years ago [4], [11]. Photodynamic therapy (PDT) and photothermal therapy (PTT) are important components of phototherapy, which can selectively treat diseased areas and have great therapeutic effects on various types of tumors [12]. Not only that, phototherapy does not conflict with other treatments, and each treatment takes less time, making life more convenient [13], [14].
Light, photosensitizers (PSs), oxygen (or other adjacent substrates) are indispensable and vital components of PDT [15], [16]. After the PS in the ground state (S0) absorbs excitation light of a specific wavelength, it produces toxic reactive oxygen species (ROS), damaging prominent proteins and subcellular organelles, thereby inducing apoptosis of tumor cells [17], [18]. PDT is used for anti-tumor treatment in three interrelated ways: (1) directly killing tumor cells; (2) damaging tumor blood vessels; (3) activating the immune system [19]. Different from PDT, the PS absorbs laser of a specific wavelength and reaches to the excited state from the S0, and then returns to the S0 through non-vibrational relaxation is called PTT process [20]. At the same time, it releases enough heat to damage the membrane structure of tumor cells or cause the inactivation of proteins and other substances, thereby achieving the purpose of tumor elimination [21], [22].
Since phototherapy has inherent selectivity for disease treatment, it only needs to give light to the lesion, thereby reducing damage to normal tissue and reducing side effects [4], [23]. Based on this, the best treatment timing can be determined by real-time monitoring of the distribution of PSs in the body and its enrichment time at the tumor site, so as to achieve the lowest drug dose and the best therapeutic effect. Fluorescence imaging technology is a high-profile non-invasive imaging method with great sensitivity and resolution [24], [25], [26], [27]. By combining fluorescence imaging technology and phototherapy, the targeting effect, therapeutic efficiency and metabolic effect of PSs on tumor sites can be determined, thereby clarifying the entire dynamic process of PSs in the body and laying a theoretical foundation for clinical translation [28]. As an essential part of fluorescence imaging, fluorophores can emit fluorescence by absorbing light of specific wavelengths [29]. Fortunately, many fluorophores have been structurally modified to possess phototherapeutic properties [30]. Therefore, the development of these PSs with fluorescence imaging properties provides a feasible strategy for real-time diagnosis and precise treatment of tumors [31], [32].
The performance of phototheranostic agents directly determines the effects of fluorescence imaging and phototherapy. Hundreds of PSs, including porphyrins, phthalocyanines, boron dipyrromethene (BODIPY), etc., have been used in clinical research on various solid tumors [33], [34], [35]. An ideal PS should have the following properties [33], [36], [37]: (1) High operability, many sites that can be modified, and simple structural modification; (2) It can possess excellent tumor targeting by itself or after modification; (3) The absorption mainly in the near-infrared region (NIR, 700–1350 nm; NIR I and NIR II), which is beneficial to reducing the interference of biological autofluorescence background and decreasing the inconvenience of life caused by the strictly avoiding light after treatment; (4) Superior quantum yield of ROS for PDT and excellent photothermal conversion efficiency (PCE) for PTT; (5) Strong safety, no dark toxicity, high biocompatibility, and easily metabolized out of the body. To meet the above requirements, researchers have designed and synthesized a series of organic molecules with fluorescent diagnostic and therapeutic functions, or constructed nanoaggregates, nanocomposites, and nanomaterials based on these functional molecules through self-assembly or co-assembly for fluorescence imaging-guided phototherapy of tumors [38].
In this review, we focus on these fluorescent therapeutic molecules or fluorescent therapeutic aggregates, fluorescent therapeutic nanocomposites based on organic molecular structures, for phototherapy of tumors. According to the different parent structures of organic parents, they are mainly divided into cyanine, tetrapyrrole structure, BODIPY, and AIEgens, which can be used for fluorescence imaging-guided PDT, PTT, and PDT combined PTT against cancers (Fig. 1). In addition, we have in-depth summarized the impact of structural modification (molecular level) or regulated aggregation mode (nano-level) on energy dissipation, providing feasible strategies for constructing PSs that meet both imaging and therapeutic effects. Moreover, we also elaborated on the ways in which molecular structure or nanostructured phototheranostic agents can enhance the effect of phototherapy, which will provide strategies for the subsequent construction of phototheranostic agents with precise tumor imaging and treatment.
Fig. 2. Schematic of the Jablonski diagram.
Table 1. Summary of fluorescence, therapeutic modalities, advantages and disadvantages of representative PSs among cyanine-based molecular or nanomaterials.
Fig. 9. (a) Chemical structure and response mechanism of IR1048-MZ; (b) Chemical structures of IR1-IR4 and the response mechanism of them.
Fig. 10. (a) Chemical structure of Cy-CO2Bz; (b) Chemical structures of Indocyanine and Quinoline cyanine; (c) Chemical structures of Cy7-TPE and Cy7-Pyrene; (d) Chemical structure of CY5-664; (e) Chemical structure of HQS-Cy.
Fig. 12. (a) Chemical structure of Met-IR-782; (b) Chemical structure of response mechanism of IR-PY and its reaction in different pH; (c) Chemical structure of IR825-Cl.
Table 2. Summary of fluorescence, therapeutic modalities, advantages and disadvantages of representative PSs among tetrapyrrole structures-based molecular or nanomaterials.
Table 3. Summary of fluorescence, therapeutic modalities, advantages and disadvantages of representative PSs among BODIPY structures-based molecular or nanomaterials.
Photosensitizer
Fl.
Ther. Mod.
Advantages
Disadvantages
Ref.
iodine disubstituted BODIPY modified erlotinib
NIR I
PDT (type II)
high molar absorption coefficient and tumor inhibition rate; EGFR-positive tumors target
Fig. 26. Chemical structure of MAB (a), (b) TAB, TAB-I, and TAB-Br; (c) BDPN, BDPI, BDPC, and BDPJ; (d) CCNU-1060; (e) BDP 2 − 7.
Table 4. Summary of fluorescence, therapeutic modalities, advantages and disadvantages of representative PSs among AIEgens-based molecular or nanomaterials.
Photosensitizer
Fl.
Ther. Mod.
Advantages
Disadvantages
Ref.
tetrastyrene derivative combined with 1O2-cleavable AA and cRGD
NIR I
PDT (type II)
high tumor targeting; monitoring of 1O2 generation; early evaluation of the therapeutic effect
synthesis steps are relatively complex; no in vivo applications
6, 7-diphenyl-[1,2,5]thiadiazolo[3,4g]quinoxaline as the acceptor, thiophene as the π bridge, phenothiazine serves as the acceptor, and a triphenylamine rotor donor is added to the phenothiazine
In this review, we summarized the organic molecules inculding cyanines, porphyrins, phthalocyanines, BODIPY, and AIEgens or nanoaggregates and nanocomposite based on these organic molecules for fluorescence imaging-guided phototherapy. Special attention is paid to the strategy of visual elimination of tumors through molecular structure modification, controlled aggregation, and assembly of functionalized nanomaterials. Obviously, this integrated approach to diagnosis and treatment demonstrates the huge potential for clinical transformation of precision tumor treatment. However, fluorescence imaging-guided phototherapy for tumor elimination still faces great challenges: (1) There is currently no fully mature method that can accurately control the fluorescence, photodynamic or photothermal intensity of all kinds of PSs. The strategies used by different PSs molecules are not completely consistent, and the design methods need to be adjusted according to the structure. (2) Maintaining photostability of fluorescence after continuous high-intensity output is a huge challenge. Meanwhile, fluorescence imaging will also face interference from background. To solve the above problems, some afterglow luminescent structures have been studied. Such structures store the energy of the illuminated light and then slowly emit photons. Song et al. have achieved tumor glycolysis and chemotherapy resistance by constructing afterglow structure; [224] in addition, this kind of materials can also quantify and image targets such as pH, superoxide anion, and aminopeptidase [225]. (3) Quantitatively evaluating the accuracy of detecting early tumor lesions through fluorescence intensity and the effectiveness of phototherapy is still limited. (4) The problem of penetration depth. There is an urgent need to further expand the fluorescence emission wavelength so that it can be used for the visual treatment of deep-seated solid tumors. Currently, photoacoustic imaging is favored due to its deeper penetration depth [226]. In addition to tumors, diseases such as atherosclerosis can also be diagnosed early through photoacoustic imaging [227], [228]. (5) Phototherapy has the disadvantage of locality, and metastatic tumors are difficult to detect or treat through this method. In this case, phototherapy needs to be used in conjunction with systemic treatments such as chemotherapy and immunotherapy to enhance the therapeutic effect of metastatic tumors.
Collectively, the use of fluorescence-imaging guided phototherapy for anti-tumor is a promising strategy. This review summarizes the progress made in this field in recent years as well as the opportunities and challenges faced. We believe that with the continuous efforts of scientific researchers and clinicians, fluorescence imaging-guided phototherapy will become a prominent feature in the field of precision tumor treatment in the future.
a State Key Laboratory of Digital Medical Engineering, School of Biomedical Engineering, Hainan University, Haikou 570228, China
b Key Laboratory of Biomedical Engineering of Hainan Province, One Health Institute, Hainan University, Haikou 570228, China
c Key Laboratory of Hainan Trauma and Disaster Rescue, The First Affiliated Hospital of Hainan Medical University, Hainan Medical University, Haikou 571199, China
d Engineering Research Center for Hainan Bio-Smart Materials and Bio-Medical Devices, Key Laboratory of Emergency and Trauma, Ministry of Education, Key Laboratory of Hainan Functional Materials and Molecular Imaging, College of Emergency and Trauma, Hainan Medical University, Haikou 571199, China
e Precision medical center, Guangyuan City Centre hospital, Guangyuan 628099, China
f School of Natural Sciences (SNS), National University of Science and Technology (NUST), H-12, Islamabad 44000, Pakistan
The photoactive agents based on triphenylamine-based aggregation-induced emission luminogens (TPA-AIEgens) for cancer theranostics were summarized, including the design principle, targeting strategies, and the latest progress in biological imaging and cancer treatment.
Abstract
Triphenylamine (TPA)-based aggregation-induced emission luminogens (TPA-AIEgens), a type of photoactive material utilizing the typical TPA moiety, has recently attracted increasing attention for the diagnostics and treatment of tumors due to their remarkable chemo-physical performance in optoelectronic research. TPA-AIEgens are distinguished from other photoactive agents by their strong fluorescence, good sensitivity, high signal-to-noise ratio, resistance to photobleaching, and lack of high concentration or aggregation-caused fluoresce quenching effects. In this review, we summarize the current advancements and the biomedical progress of TPA-AIEgens in tumor theranostics. First, the design principles of TPA-AIEgens photoactive agents as well as the advanced targeting strategies for nuclei, cell membranes, cell organelle and tumors were introduced, respectively. Next, the applications of TPA-AIEgens in tumor diagnosis and therapeutic techniques were reviewed. Last, the challenges and prospects of TPA-AIEgens for cancer therapy were performed. The given landscape of the TPA-AIEgens hereby is meaningful for the further design and utilization of the novel photoactive material, which could be beneficial for the development of clinic applications.
1.Introduction
Malignant tumors are the primary cause of human mortality, which represent a severe threat to human health and survival [1]. Nowadays, surgery, radiation, and chemotherapy are the three primary traditional treatments. Unfortunately, these traditional treatments suffer defects, such as significant systemic side effects and high recurrence rates [2,3]. Recently, phototheranostics have made significant contributions to cancer treatment due to their light-controllability, non-invasiveness, specific target, low toxicity, and good selectivity [4-6]. Normally, photodynamic therapy (PDT) and photothermal therapy (PTT) are two types of phototherapies that exogenous photosensitizing agents are involved to selectively kill tumors or inhibit tumor growth with light radiation [7,8]. In PDT, photosensitizers (PSs) are typically used to generate cytotoxic reactive oxygen species (ROS), such as singlet oxygen (1O2), superoxide (O2––) and hydroxyl radical (–OH), which is able to eliminate tumor cells [5,9]. Photothermal agents can enhance the heating process of cells and tissues in the local area by absorbing laser energy and converting it into heat [10-12], which is similar to laser therapy [13]. The main discrepancy is that laser therapy uses endogenous chromophores with non-selectivity towards malignant cells, while PTT with exogenous agents can specifically target cancer cells. With the aid of photoactive agents, both the PDT and PTT can produce vigorous interaction with biological substances, leading to the immunogenic cell death (ICD), vascular injury, and immunological response [14-17].
Recently, the photoactive agents based on AIE luminogens (AIEgens) developed by Tang Benzhong’s research group have made breakthroughs in phototherapy research. An interesting phenomenon termed aggregation-induced emission (AIE) occurs when a series of non-emissive molecules in the dispersed state are induced to show strong emission upon aggregate formation or in solid state [18]. Due to the existence of the strong electron-vibration coupling in the dispersed state, AIE molecules demonstrate the intrinsic non-radiative transitions and fluorescence quench. In the aggregated state, the molecular environment’s restriction of intramolecular movements (RIM) might impair the electron-vibrational coupling of molecular system, resulting in depressed non-radiative transitions and enhanced fluorescence [19,20]. In general, the clinical diagnostic agents (e.g. ICG, porphyrin) suffer from certain problems such as aggregation-induced fluorescence quenching (ACQ) and photobleaching [21,22]; while AIEgens offers the following benefits compared to the traditional fluorescent dyes: 1) high-intensity fluorescence; 2) efficient light conversion; 3) strong stability; 4)luminescence regulation by flexible chemical modification; 5) high resolution in biological imaging [23,24].
The fundamental AIE motifs, such as tetraphenylene (TPE), triphenylamine (TPA), 2,3,4,5-tetraphenylsiloles (TPS), phenylvinyl anthrance, and phenyl substituted pyrrole, are integral to the creation of AIE materials [25]. In contrast to typical TPE-AIEgens, TPA-AIEgens is more flexible to be designed for in vivo applications such as high water-solubility and strong NIR II absorption. The chemical structure of TPA is composed of three benzene rings and a central nitrogen atom. Due to its unique helical structure and three phenyl rotors, TPA not only plays a role as the strong electron donor but also acts as a molecular rotor, making it easy to construct a variety of TPA-AIEgens. As an electron donor, TPA is combined with an electron acceptor to obtain a molecule with donor-acceptor (D-A) structure resulting in an adjusted intramolecular push-pull electron interaction, which benefits the red-shift of fluorescence and/or enhances intersystem crossing (ISC) process to generate more ROS [25,26]. When acting as a molecular rotor, the highly distorted conformation of TPA increases the molecular distance, reducing the intermolecular π-π packing and retaining the intramolecular rotation, which is beneficial to promote fluorescence and/or heat generation [27,28]. Therefore, TPA is a crucial functional segment in the construction of TAP-AIEgens.
Up to now, TPA-AIEgens have been developed as novel molecular materials with photosensitive and photothermal capabilities, demonstrating the huge potential in tumor theranostics [29]. Thus, the design principles, targeting strategies, and the latest progress in biological imaging and treatment based on TPA-AIEgens photoactive agents are summarized in this minireview (Scheme 1). First, the principles of design TPA-AIEgens with near-infrared absorption and good biocompatibility were summarized. Next, TPA-AIEgens targeting strategies, including targeting to nuclei, cell membranes, cell organelles and tumors, were presented. Then it introduced the application of TPA-AIEgens in biological imaging and phototherapy for the most recent years. Finally, the photoactive agents based on TPA-AIEgens for cancer treatment were prospected. We hope this review can provide valuable information for design and application of TPA-AIEgens to accelerate their clinical translation.
Scheme. 1. TPA-AIEgens for cancer theranostic, including targeting strategies, biological imaging and cancer treatment.
Fig. 1. Typical TPA-AIEgens used for cancer diagnosis and treatment. Compound 1–3 with extended π system to obtain the red-shifted and high fluorescence emission; compound 4 and 5 with rigid and strong acceptor unit to promote the fluorescence quantum yield; compound 6 and 7 with low ∆Est values to enhance ROS generation; compound 8–10 with increased steric hindrance to red shift to NIR II emission; compound 11 and 12 with TICT state to boost photothermal conversion property.
Fig. 2. (a) Schematic illustration of MeTPAE with nuclei-targeting function for PDT. Reproduced with permission [59]. Copyright 2022, Wiley-VCH. (b) Schematic illustration of molecular design diagram of a high-performance AIE photosensitizer with cell membrane-targeting function for fluorescence imaging-guided PDT. Reproduced with permission [61]. Copyright 2022, The Royal Society of Chemistry.(c) Schematic illustration of the structure of DBP, TBP, and TBP-SO3. Reproduced with permission [67]. Copyright 2022, The Royal Society of Chemistry. (d) Schematic illustration of the structure of TTT-1, TTT-2, TTT-3 and TTT-4. Reproduced with permission [70]. Copyright 2021, Elsevier.(e) Schematic diagram of the structure of 1,4-dihydropyridine derivatives for both LDs and ER-targeting imaging and therapy. Reproduced with permission [72]. Copyright 2023, Wiley-VCH
Fig. 3. (a) Molecular design and synthetic route of TBP-Au. (b) Schematic illustration of TBP-Au for anticancer therapeutics through synergistic effects of photodynamic therapy and TrxR inhibition. (c) In vivo real-time fluorescence imaging in HeLa tumor-bearing nude mice after intratumor injection of TBP-Au (λex: 530 nm). Reproduced with permission [85]. Copyright 2021, American Chemical Society. (d) In vivo real-time PA images of the tumor site in the mice after tail intravenous injection with TBTO NPs. (e) In vivo real-time NIR fluorescence imaging in tumor site after intratumoral injection with TBTO NPs. Reproduced with permission [89]. Copyright 2021, Elsevier
6. Conclusion and outlook
In this review, we summarized recent advances of TPA-AIEgens for cancer theranostics. Compared to clinical photoactive agents, TPA-AIEgens shows unique and excellent advantageous such as bright emission, robust ROS generation, high photothermal conversion efficacy, resulting in improved antitumor efficacy. By rational design, TPA-AIEgens demonstrate NIR II absorption/emission, enhanced phototherapy. Owing to AIE characteristics, TPA-AIEgens is available to visualize the tumor foci, which plays a vital role in the clinic diagnosis and image-guided surgeons. Moreover, the PDT and PTT combined with immunotherapy, could be a promising approach to enhance the immunotherapy efficiency. (Table 1).
Despite impressive advancements of TPA-AIEgens in the realm of biomedicine, there are still certain problems and challenges for clinical application. First, TPA-AIEgens suffer from poor targeting capability of tumors and the accumulation of TPA-AIEgens mainly relies on the EPR effect. By modifying the size, shape, structure, surface charge, and target ligands of nanovehicles [113-115], it will be possible to create TPA-AIEgens photoactivators furnishing with unique active targeting 爌roperties for accurate and effective anti-tumor treatment in future. Second, the relationship between structure and target properties of TPA-AIEgens should be systematically studied, which will provide theoretical guidance for further development of the TPA-AIEgens to fulfill clinical requirements. Third, most of the excitation wavelengths of TPA-AIEgens are in the visible range. Compared to those dyes with an absorption in the NIR biological window, TPA-AIEgens encounter the challenges in imaging of deep tissue and high resolution requiremen [116-118]. Besides, TPA-AIEgens, as the photoactive agents, still require rigorous investigation on the therapeutic immunological mechanism and in vivo ADMET (absorption, distribution, metabolism, excretion, and toxicity) properties. Different strategies including the structure design of the probes which have been discussed in section 3, have achieved substantial developments and will definitely promote their transition by addressing the clinical concerns. [108,119]. Last but not least, biosafety issues are inevitable for the development of novel TPA-AIEgens. Biodegradability and long-term toxicity to humans must be considered to meet the demands of clinical translation. Consequently, in order to achieve the therapeutic effect of totally curing malignancies and successfully preventing tumor metastasis and recurrence, it is imperative to conduct in-depth research on TPA-AIEgens through the aforementioned aspects. In future research, the biomedical application of TPA-AIEgens in tumor diagnosis and treatment systems can be vigorously promoted.
Table 1 The summary of TPA-AIEgens for tumor theranostics.
Near-Infrared Fluorescence Probe for Indication of the Pathological Stages of Wound Healing Process and Its Clinical Application
Xianzhu Luo【罗贤柱】,Shaowen Cheng【程少文】,Wei Zhang【张伟】,Kun Dou【窦昆】,Rui Wang【王锐】*, and Fabiao Yu【于法标】*
a Key Laboratory of Hainan Trauma and Disaster Rescue, Department of Wound Repair, The First Affiliated Hospital of Hainan Medical University, Hainan Medical University, Haikou 571199, China
b Engineering Research Center for Hainan Bio-Smart Materials and Bio-Medical Devices, Key Laboratory of Emergency and Trauma, Ministry of Education, Key
Laboratory of Hainan Functional Materials and Molecular Imaging, College of Emergency and Trauma, Hainan Medical University, Haikou 571199, China
Chronic wound healing is one of the most complicated biological processes in human life, which is also a serious challenge for human health. During the healing process, multiple biological pathways are activated, and various kinds of reactive oxygen species participate in this process. Hydrogen peroxide (H2O2) involves in chronic wounds and its concentration is fluctuated in different pathological stages during the wound healing process. Therefore, H2O2 may be recognized as a powerful biomarker to indicate the wound healing process. However, the pathological roles of H2O2 cannot be fully understood yet. Herein, we proposed a near-infrared fluorescent probe DCM-H2O2 for highly sensitive and rapid detection of H2O2 in living cells and scald and incision wound mice models. DCM-H2O2 exhibited a low detection limit and high specificity with low cytotoxicity for H2O2, which had great potential for its application in vivo. The probe was successfully utilized to monitor the fluctuation of endogenous H2O2 in the proliferation process of human immortalized epidermal (HACAT) cells, which confirmed that H2O2 participated in the cells’ proliferation activity through a growth factor signaling pathway. In the scald and incision wound mice models, H2O2 concentration fluctuations at different pathological stages during the wound healing process could be obtained by in vivo fluorescence imaging. Finally, H2O2 concentrations in different stages of human diabetic foot tissues were also confirmed by the proposed probe. We expect that H2O2 could be a sensitive biomarker to indicate the wound healing process.
Chronic wound healing remains a global challenge and one of the major common public health problems that cannot be ignored [1-3]. It is a complex physiological process that consists of hemostasis, inflammation, proliferation and remodeling [4, 5]. Unfortunately, bacterial infection or other diseases (destructive irriation, diabetes mellitus) may interfere with wound healing, leading to impaired structural and functional regeneration of entire skin tissue, which in turn may lead to severe disability and even increased mortality [6, 7]. Therefore, monitoring changes in physiological parameters during wound healing is crucial to understand the state and physiological process of wound healing, which can help identify wound infections and subsequent treatment. The current clinical evaluation of wounds healing mainly focuses on planimetry to quantitatively detect the changes of wound size and granulation tissue formation. Although this method can reflect the macroscopic changes in the wound, it cannot show the regulation at the molecular level.
Excessive infiltration of neutrophils appears to be one of the culprits of chronic wound healing [8]. Abundant ROS in neutrophils is involved in all phases of wound healing, which can cause oxidative stress and adversely affect wound healing even prevent new tissue formation [9-12]. As a critical member of ROS, hydrogen peroxide (H2O2) has been considered as an intracellular second messenger, which plays key roles in various physiological processes including cell growth, inflammation treatment, proliferation and differentiation, and activation of immune cells [13-15]. The previous researches indicate that H2O2 involves in wound healing and its concentration is fluctuated in different pathological stages during the wound healing process [16-20]. Therefore, H2O2 may be considered as a powerful biomarker to indicate the chronic wound healing process.
Although visual observation is the simplest and most versatile means of initial diagnosis of chronic wounds, it relies on the certain clinical experience and cannot predict the effect of treatment and the stage of healing [21]. Therefore, there is an urgent need to develop rapid and sensitive tools to detect H2O2 to accurately identify the various states of chronic wound healing [22]. Recently, fluorescent probes have been considered as powerful tools to monitor biological active species and processes due to their non-invasiveness, high sensitivity, and excellent spatial and temporal resolution [23-29]. Some fluorescent probes have been reported for monitoring H2O2 in living cells and in vivo through the careful design; however, the probes for monitoring the concentration fluctuation during the chronic wound healing process are still challenging [30-34]. Moreover, compared to the fluorescent emission in the visible light region, fluorescent probes with excitation/emission wavelength in the near-infrared (NIR) region get benefit from the low background interference, small light damage and deep penetration, which are more suitable for bioimaging [35-37]. With this in mind, we attempt to develop a NIR fluorescent probe for rapid and highly sensitive detection of H2O2 in living cells and in vivo to track the concentration fluctuations of H2O2 during the chronic wound processes.
Herein, we proposed a NIR fluorescent probe DCM-H2O2 with large Stokes shift for investigating the fluctuation of H2O2 level during chronic wound healing process in wound mice models and human diabetic foot tissues. The probe comprised of pentafluorobenzenesulfonyl ester group as recognition moiety of H2O2 and dicyanomethylene-benzopyran (DCM) as NIR fluorophore. In the presence of H2O2, DCM-H2O2 exhibited rapid response to H2O2 with large Stokes shift, emitting a brilliant fluorescent signal at 695 nm. Furthermore, DCM-H2O2 displayed low cytotoxicity and excellent biocompatibility. Then, the proposed probe was applied to monitor the fluctuations of H2O2 level during the healing process of scald and incision wound mice models and in variouspathological stages of the human diabetic foot, which contributed to comprehend the role of H2O2 in the physiological process. The probe could act as an effective tool to help diagnose the various stages of chronic wound healing that assisted with further treatment.
Scheme 1. The molecular structure of DCM-H2O2 and its proposed response mechanism towards H2O2.
Figure 1. The spectral properties and selectivity of DCM-H2O2. (A) The UV-Vis absorption spectra of DCM-H2O2 toward H2O2 (0 – 50 µM) for 5 min in PBS (pH =7.4, 10 mM, PBS: DMSO=7:3, v/v). (B) The fluorescence emission spectra of DCM-H2O2 toward H2O2 (0 – 50 µM) for 5 min in PBS (pH=7.4, 10 mM, PBS: DMSO=7:3, v/v). (C) The linear relationship between the fluorescence intensity of DCM-H2O2 and various levels of H2O2. (D) Time-dependent fluorescent intensity toward H2O2 during 0 – 360 s, and the probe was added at 30 s. (E) The fluorescence spectra of DCM-H2O2 toward other analytes. (F) The fluorescent response of DCM-H2O2 to various reactive species at 10 min: 1. blank; 2. H2O2; 3. ONOO–; 4. HNO; 5. NO; 6. ·OH; 7. tBuOO·; 8. O2·-; 9. OCl–; 10. Cys; 11. GSH; 12. Hcy. The experiments were repeated three times and the data were shown as mean (± S.D.).
Figure 2. Fluorescence imaging of endogenous and exogenous H2O2 in living cells. (A) Fluorescent imaging of exogenous H2O2 in HeLa cells at different time points: 0 min, 5 min, 10 min, 20 min and 30 min. (B) Fluorescent imaging of exogenous H2O2, HClO and ONOO– in RAW 264.7 cells. The RAW 264.7 cells were treated with H2O2 (10 µM, 30 µM), ClO– and ONOO– donor (SIN-1), and then incubated with probe (10 µM), respectively. (C) Fluorescent imaging of endogenous H2O2 in RAW 264.7 cells. Control group: RAW 264.7 cells was incubated with the probe DCM-H2O2; PMA group: The RAW 264.7 cells were treated with PMA (1 μg/mL) for 6 h and then incubated with the probe DCM-H2O2; PMA + NAC group, PMA+ebselen, and PMA+L-NAME group: the cells were preincubated with NAC (1 mM), ebselen (5 μM), and L-NAME (5 mM) and then tread with probe, respectively. (D-F) Relative mean fluorescent intensities in A-C. Fluorescence collection windows for red channel: λex = 561 nm, λem = 650 – 730 nm and blue channel (DAPI): λex = 405 nm, λem = 420 – 480 nm. The experiments were repeated five times and the data were shown as mean (± S.D.).
Figure 3. Fluorescence images and flow cytometry analysis of H2O2 in HACAT cells via DCM-H2O2. (A) The cells were treated with the probe DCM-H2O2 (10 μM). (B) The cells were incubated with EGF (500 ng/mL) for 30 min and then treated with probe. (C) The cells loaded with DCM-H2O2 were pretreated with PD153035 and then stimulated with EGF. (D) The cells loaded with DCM-H2O2 were pretreated with wortmannin and then stimulated with EGF. (E) The cells loaded with DCM-H2O2 were pretreated with apocynin before stimulated with EGF. (F) The flow cytometry analysis of the cells in A-E. (G) Relative mean fluorescent intensities in A-E. (H) Relative mean fluorescent intensities in F. The fluorescence collection windows for red channel (DCM-H2O2): λex = 561 nm, λem = 650 – 730 nm and blue channel (DAPI): λex = 405 nm, λem = 420 – 480 nm. The experiments were repeated five times and the data were shown as mean (± S.D.).
Figure 4. Time-dependent fluorescence images of H2O2 in wound healing models. (A) Fluorescence images of H2O2 withDCM-H2O2in healing process of scald wound mouse model at different time points (1 h, 2 h, 4 h, 8 h, 12 h, 24 h, 2 d, 3 d, 5 d, 7 d and 11 d). (B) Fluorescence images of H2O2 withDCM-H2O2in healing process of incision wound mouse model at different time points (1 h, 2 h, 4 h, 8 h, 12 h, 24 h, 2 d, 3 d, 5 d, 7 d and 11 d). (C) Relative mean fluorescent intensities in A. (D) Relative mean fluorescent intensities in B. The fluorescence collection windows for red channel: λex = 561 nm, λem = 650 – 730 nm. The experiments were repeated five times and the data were shown as mean (± S.D.). (E) The fluorescence detection of vitro vital organs (from left to right: heart, liver, spleen, lung, and kidney). (F) H&E and Masson staining for normal mice skin, period of inflammation of scald mice skin (8 h) and incision mice skin (48 h).
Figure 5. Fluorescent imaging in the tissues of the different physiological stages of the human diabetic foot. (A) Photographs of clinical samples. (B) H&E staining. (C) Fluorescence imaging of lesion skin tissues at lesion stages. The fluorescence collection windows for red channel: λex = 561 nm, λem = 650 – 730 nm. (D) Three-dimensional (3D) images of (B). (E) Mapping of Z-line sequential images for dysplasia slice at a depth interval of 10 μm (diabetic foot stage V).
4. Conclusion
In summary, we reasonably designed and synthesized a NIR probe (DCM- H2O2) to track the concentration fluctuations of H2O2 during the scald and incision wound healing process and the human diabetic foot tissues. The probe exhibited high sensitivity and specificity, and can respond quickly to H2O2. DCM-H2O2 was employed to detect exogenous and endogenous H2O2 and investigated the fluctuation of H2O2 during the proliferation of HACAT cells. Furthermore, the real-time imaging of H2O2 in the process of scald and incision wound mice models strongly demonstrated that the proposed probe could track the concentration fluctuations of H2O2 during the wound healing process. This study is helpful to better understand the role of H2O2 in wound healing process. Furthermore, the probe was employed to image H2O2 in clinical diabetic foot samples, providing a new strategy for differentiating the pathological stages of the diabetic foot.
a Jiangsu Co-Innovation Center of Efficient Processing and Utilization of Forest Resources, International Innovation Center for Forest Chemicals and Materials, College of Chemical Engineering, Nanjing Forestry University, 159 Longpan Road, 210037, Nanjing, China.
b Key Laboratory of Hainan Trauma and Disaster Rescue, Key Laboratory of Haikou Trauma, The First Affiliated Hospital of Hainan Medical University, Hainan Medical University, Haikou 571199, China.
c Engineering Research Center for Hainan Bio-Smart Materials and Bio-Medical Devices, Key Laboratory of Emergency and Trauma, Ministry of Education, Key Laboratory of Hainan Functional Materials and Molecular Imaging, College of Emergency and Trauma, Hainan Medical University, Haikou 571199, China
Peroxynitrite (ONOO–), as a short-term reactive biological oxidant, could lead to a series of effects in various physiological and pathological processes due to its subtle concentration changes. In vivo monitoring of ONOO– and relevant physiological processes is urgently required. Herein, we describe a novel fluorescent probe termed HBT-Fl-BnB for the ratiometric detection of ONOO– in vitro and in vivo. The probe consists of an HBT core with Fl groups at the ortho and para positions responding to the zwitterionic excited-state intramolecular proton-transfer (zwitterionic ESIPT) process and a boronic acid pinacol ester with dual roles that block the zwitterionic ESIPT and recognize ONOO–. Thanks to the specificity as well as low cytotoxicity, success in imaging of endogenous and exogenous ONOO– in living cells by HBT-Fl-BnB was obtained. Additionally, the applicability of HBT-Fl-BnB to tracking the abnormal expression of ONOO– in vivo induced by inactivated Escherichia coli was also explored. This is the first report of a fluorescent probe for ONOO– sensing via a zwitterionic ESIPT mechanism.
Figure 1. (a) Fluorescence spectra of HBT-Fl-BnB, HBT-Fl and HBT-Fl-BnB with excess ONOO− (10 μM, and 10 mM PBS buffer with 5% THF, 0.2% Tween, pH = 7.4, λex = 340 nm), and (b) the plot of fluorescent intensity of HBT-Fl (10 μM) at 584 nm vs.water fractions (%, fw) in the PBS buffer-THF mixture, λex = 360 nm; and (c,d) DFT calculations of the molecular frontier orbitals and energy levels of the Me derivative of HBT-Fl-BnB.
Figure 2. (a) Fluorescence spectra of HBT-Fl-BnB upon the addition of ONOO− (0‒100 μM), inset: the ratio ofFI583/FI396vs. ONOO− (0.0-100 μM); (b) Linearity for the ratio ofFI583/FI396vs.ONOO− concentrations (0.0-25 μM); Fluorescent intensity ratio (FI583/FI396) of HBT-Fl-BnB upon (c) adding ONOO− or other interfering analytes respectively, and (d) adding ONOO− in the presence of competitive analytes. Test conditions: 10 μM HBT-Fl-BnB, and 10 mM PBS buffer with 5% THF, 0.2% Tween, pH = 7.4, λex = 340 nm). Other interfering analytes: ONOO‒, 1O2, ·OH, HOCl, H2O2, NO, TBHP, GSH, L-Cys, Sec, Cys-SSH, Fe3+, Zn2+, F‒, I‒, SO42‒, NO2‒, HCO3‒, CO32‒ and S2O32‒.
方案2. HBT-Fl-BnB检测ONOO的拟议反应机制。
Scheme 2. Proposed reaction mechanism of HBT-Fl-BnB towards detecting ONOO−.
图 3. Raw264.7 细胞的共焦荧光成像。
Figure 3. Confocal fluorescence imaging of Raw264.7 cells. (a) Control group: cells were only incubated with HBT-Fl-BnB. Cells were stimulated with exogenous ROS/RNS: (b) H2O2; (c) HOCl; (d) NO; (e) O2·−; (f) ONOO− (10 μM in PBS buffer), then with HBT-Fl-BnB. 430ch: λem= 415-515 nm, 583ch: λem=550-650 nm. Ratio images generated from 583ch/430ch. λex=405 nm, scale bar: 20 μm. (g) Normalized average fluorescence intensity of Fl583/Fl430. *** P<0.001. The experiments were repeated three times and the data were shown as mean (±S.D.).
图 4. Raw264.7 细胞的共焦荧光成像。
Figure 4. Confocal fluorescence imaging of Raw264.7 cells. Cells were stimulated with different concentrations of ONOO−, (a) 0; (b) 2); (c) 4); (d) 6; (e) 8 and (f) 10 μM, then with HBT-Fl-BnB. 430ch: λem= 415-515 nm, 583ch: λem=550-650 nm. Ratio images generated from 583ch/430ch. λex=405 nm, scale bar: 20 μm. (g) Normalized average fluorescence intensity of Fl583/Fl430. * P<0.05,** P<0.01 *** P<0.001. The experiments were repeated three times and the data were shown as mean (±S.D.).
图 5. Raw264.7 细胞的共焦荧光成像。
Figure 5. Confocal fluorescence imaging of Raw264.7 cells. (a) Control group: cells were only incubated with HBT-Fl-BnB. Cells were stimulated with different stimuli: (b) LPS (1 μg/mL); (c) IFN-γ (50 ng/mL); (d) PMA (10 nmol/L); (e) LPS (1 μg/mL) + IFN-γ (50 ng/mL); (f) LPS (1 μg/mL) + IFN-γ (50 ng/mL), then with PMA (10 nmol/L); and (g) AG (1 mmol/L) + LPS ( 1 μg/mL) + IFN-γ (50 ng/mL), then with PMA (10 nmol/L); then were further incubated with HBT-Fl-BnB. 430ch: λem=415-515 nm, 583ch: λem=550-650 nm. Ratio images generated from 583ch/430ch. λex=405 nm, scale bar: 20 μm. (h) Normalized average fluorescence intensity of Fl583/Fl430. ** P<0.01 *** P<0.001. The experiments were repeated three times and the data were shown as mean (±S.D.).
图 6. 在大肠杆菌引起急性腹膜炎期间用小鼠荧光成像监测 ONOO−。
Figure 6. Fluorescence imaging of mice to monitor ONOO−during the Escherichia coli caused acute peritonitis. Mice were intraperitoneally injected with inactivated Escherichia coli (2 × 10⁷ CFU), and after (a) 0, (b) 6, (c)12, (d) 24, (e) 36, (f) 72 h, HBT-Fl-BnB (50 μM, 200 μL) was injected through the tail vein. (g) Normalized average fluorescence intensity of Fl583/Fl430.430ch: λem=415-515 nm, 583ch: λem=550-650 nm. λex=405 nm. (h)Changes of WBC during acute peritonitis in mice. * P<0.05,** P<0.01 *** P<0.001. The experiments were repeated three times and the data were shown as mean (±S.D.).
Conclusion
In summary, a novel ratiometrically fluorescent probe HBT-Fl-BnB featuring a zwitterionic ESIPT was firstly synthesized to detect ONOO− in vitro and in vivo. An HBT core with two Fl groups at the ortho and para positions of OH responding to the zwitterionic ESIPT, and a boronic acid pinacol ester possessing dual roles that blocking the zwitterionic ESIPT as well as sensing ONOO− are both presented in HBT-Fl-BnB. This designed probe enabled a quantitative and ratiometric detection of ONOO− with high selectivity and sensitivity. Considering the low cytotoxicity and high selectivity of HBT-Fl-BnB towards ONOO−, the success in monitoring and imaging of endogenous and exogenous ONOO− in living cells and mice was obtained. Importantly, the abnormal expression of ONOO− in vivo induced by inactivated Escherichia coli was also confirmed by HBT-Fl-BnB, which provided a potential strategy to understand relevant pathogenic mechanism. We envision that this strategy will inspire future probe design with infrared emission.
GSK343 modulates macrophage M2 polarization through the EZH2MST1YAP1 signaling axis to mitigate neurological damage induced by hypercalcemia in CKD mice
a
Department of Medicine, Hainan Medical University, The First Affiliated Hospital of Hainan Medical University, No. 31 Longhua Road, Haikou 570102, Hannan, China
b
Department of Nephrology, Charité – Universitätsmedizin Berlin, Campus Mitte, Berlin 10117, Germany
c
Fifth Department of Medicine (Nephrology/Endocrinology/Rheumatology), University Medical Centre Mannheim, University of Heidelberg, Heidelberg, Germany
d
Department of Neurology and Neuroscience, Okayama University School of Medicine, Okayama 700-8558, Japan
e
Key Laboratory of Emergency and Trauma, Ministry of Education, Key Laboratory of Hainan Trauma and Disaster Rescue, The First Affiliated Hospital of Hainan Medical University, College of Pharmacy, Institute of Functional Materials and Molecular Imaging, College of Emergency and Trauma, Hainan Medical University, Haikou 571199, China
f
Reproductive and Genetic Hospital of CITIC-Xiangya, Changsha, China
g
Kuratorium für Dialyse und Nierentransplantation (KfH) – Bildungszentrum, Martin-Behaim-Str. 20, Neu-Isenburg 63263, Germany
h
Institute of Medical Diagnostics, IMD Berlin, Berlin, Germany
Received 16 October 2023, Revised 11 January 2024, Accepted 16 January 2024, Available online 18 January 2024, Version of Record 29 January 2024.
•The study offers new insights for treating hypercalcemia-induced neurological issues in CKD.
Abstract
Chronic kidney disease (CKD) often culminates in hypercalcemia, instigating severe neurological injuries that are not yet fully understood. This study unveils a mechanism, where GSK343 ameliorates CKD-induced neural damage in mice by modulating macrophage polarization through the EZH2/MST1/YAP1 signaling axis. Specifically, GSK343 downregulated the expression of histone methyltransferaseEZH2 and upregulated MST1, which suppressed YAP1, promoting M2 macrophage polarization and thereby, alleviating neural injury in hypercalcemia arising from renal failure. This molecular pathway introduced herein not only sheds light on the cellular machinations behind CKD-induced neurological harm but also paves the way for potential therapeutic interventions targeting the identified axis, especially considering the M2 macrophage polarization as a potential strategy to mitigate hypercalcemia-induced neural injuries.
Keywords
GSK343
Chronic kidney disease
Hypercalcemia
Neurological injury
EZH2/MST1/YAP1 axis
Macrophage polarization
Introduction
Chronic Kidney Disease (CKD), particularly when it escalates to kidney failure, often precipitates a concurrent condition of hypercalcemia, with such instances evidenced in a plethora of prior research [1,2]. The accumulation of excessive calcium, or calcium overload, is a well-documented contributor to neuronal demise and substantive damage to the central nervous system [3]. In the intricate milieu of the central nervous system, macrophages, hailed for their pivotal roles in pathological events, can be stratified into two distinct phenotypes: the pro-inflammatory M1 and the anti-inflammatory M2, each harboring unique functional and therapeutic implications [4,5]. Several studies illuminate the potential of leveraging M2 macrophage polarization as a therapeutic avenue for nerve repair and regeneration [6].
Delving into the molecular mechanisms, GlaxoSmithKline 343 (GSK343) emerges as a potent inhibitor of EZH2, a catalytic component of PRC2 that is enmeshed in a myriad of biological cascades [7]. Interestingly, EZH2 has been spotlighted in recent narratives as a prospective target for kidney pathologies, given its capacity to mitigate acute kidney injury and impede renal fibrosis when inhibited [8]. Moreover, EZH2 has the ability to curtail the expression of STE20-like kinase-1 (MST1) by dampening the activity of the MST1 promoter [9], an enzyme intrinsically intertwined with the Hippo signaling pathway, a crucial regulator of cellular behaviors including proliferation and differentiation [10]. It has been illustrated that the diminution of MST1 expression can ameliorate the pathological alterations observed in diabetic kidneys and stymie the progression of diabetic nephropathy [11]. Concurrently, Yes-associated protein 1 (YAP1), a salient effector within the Hippo signaling cascade, is frequently implicated in oncogenic processes [12]. Notably, the activation of YAP instigated by MST1 inhibition can stimulate EMT and fibrosis within renal tubular epithelial cells [13], while elevated YAP expression has been demonstrated to inhibit macrophage M2 polarization [14].
In light of these insights, the present study endeavored to utilize a CKD mouse model to probe into whether GSK343, by modulating the EZH2/MST1/YAP1 axis, could facilitate M2 macrophage polarization, and subsequently ameliorate neural damage induced by hypercalcemia concomitant with kidney failure. This exploration aims to decipher the underlying mechanisms and offer viable therapeutic strategies for CKD management.
Fig. 1. Significance of critical genes related to resultant nerve damage from kidney failure-induced hypercalcemia. A, A heat map of the expression of significantly upregulated genes in the cerebral cortex with kidney failure-induced hypercalcemia from RNA sequencing. The expression value is shown in the color scale on the right. B, Venn diagram of the GeneCards RNA sequencing and DisGeNET prediction results. C, Expression of EZH2 in normal samples (blue box, n = 3) and CKD samples (red box, n = 3) following RNA-sequencing analysis. D, H3K27me3 modification at the promoter of MST1 analyzed by UCSC. E, Expression of MST1 in normal samples (blue box, n = 3) and CKD samples (red box, n = 3) following RNA-sequencing analysis. F, Expression of YAP1 in normal samples (blue box, n = 3) and CKD samples (red box, n = 3) following RNA-sequencing analysis. G, An interaction network of genes interacting with YAP1 constructed by GeneMANIA. H, Bubble chart of KEGG enrichment analysis of YAP1 and its interacting genes. The ordinate represents the enriched entry identifier, and the abscissa and bubble size represent the number of genes enriched in the identifier. The color of the bubble on the right indicates the -log p value. (For interpretation of the references to color in this figure legend, the reader is referred to the web version of this article.)
Fig. 2. GSK343 polarizes macrophages toward the M2 phenotype and alleviates nerve damage induced by hypercalcemia in CKD mice. A, Body weight of CKD mice or those treated with GSK343 from day 0 to 7. B, The DAI of CKD mice or those treated with GSK343. C, Levels of Scr and BUN in the serum of CKD mice or those treated with GSK343. D, Blood calcium concentration in CKD mice or those treated with GSK343. E, HE and Masson’s trichrome staining analysis of kidney tissue damage in CKD mice or those treated with GSK343. F, RT-qPCR and immunoblotting of albumin expression, Kim-1, PAI-1, FN, SMA, and Col. G, Nerve function changes in CKD mice or those treated with GSK343. H, Immunoblotting of iNOS and Arg1 proteins in the brain tissue of CKD mice or those treated with GSK343. I, Immunofluorescence staining of iNOS- and Arg1-positive macrophages in the brain tissues of CKD mice or those treated with GSK343. J, Flow cytometry used to observe CD38-positive (M1-type macrophages) and Egr2-positive (M2-type macrophages) macrophages in mouse brain tissue. K, TUNEL-positive cells in the hippocampal CA1 region of the CKD mice or those treated with GSK343. L, HE staining analysis of the hippocampal CA1 region and cerebral cortex of CKD mice or those treated with GSK343. n = 8 mice in each treatment. * p < 0.05, compared with normal mice. # p < 0.05, compared with CKD mice.
Fig. 3. GSK343 increases the expression of MST1 by reducing EZH2 expression. A, IHC staining and immunoblotting of EZH2 and MST1 proteins in the kidney tissue of CKD mice or those treated with GSK343 (n = 8, p < 0.05, compared with normal mice, # p < 0.05, compared with CKD mice). B, EZH2 and MST1 expression determined by RT-qPCR in TCMK-1 cells treated with GSK343. C, EZH2 and MST1 expression determined by immunoblotting in TCMK-1 cells treated with GSK343. D, EZH2 expression determined by RT-qPCR in TCMK-1 cells treated with oe-EZH2. E, EZH2 expression determined by immunoblotting in TCMK-1 cells treated with oe-EZH2. F, EZH2 and MST1 expression determined by immunoblotting in TCMK-1 cells treated with GSK343 or combined with oe-EZH2. * p < 0.05, compared with TCMK-1 cells treated with oe-NC or with control + oe-NC. # p < 0.05, compared with cells treated with GSK343 + oe-NC. All cell experiments were conducted three times independently.
Fig. 4. GSK343 polarizes macrophages toward the M2 phenotype and reduces nerve damage induced by hypercalcemia in CKD mice by regulating the EZH2/MST1 axis. CKD mice were treated with GSK343 + oe-NC, GSK343 + oe-EZH2 + oe-NC or GSK343 + oe-EZH2 + oe-MST1. A, the Transfection efficiency of MST1 overexpression determined by RT-qPCR in TCMK-1 cells. B, EZH2 and MST1 expression determined by RT-qPCR in kidney tissues of CKD mice. C, Body weight of CKD mice from day 0 to 7. D, DAI of CKD mice. E, Levels of Scr and BUN in the serum of CKD mice. F, Blood calcium concentration in CKD mice. G, HE and Masson’s trichrome staining analysis of kidney tissue damage in CKD mice. H, RT-qPCR and immunoblotting of albumin expression, Kim-1, PAI-1, FN, SMA, and Col. I, Nerve function changes in CKD mice. J, immunoblotting of iNOS and Arg1 proteins in the brain tissue of CKD mice. K, Immunofluorescence staining of iNOS- and Arg1-positive macrophages in the brain tissues of CKD mice. L, Flow cytometry used to observe CD38-positive (M1-type macrophages) and Egr2-positive (M2-type macrophages) macrophages in the brain tissue of each group of mice. M, TUNEL-positive cells in the hippocampal CA1 region of the CKD mice. N, HE staining analysis of the hippocampal CA1 region and cerebral cortex of CKD mice. n = 8 mice in each treatment. *, p < 0.05, compared with CKD mice treated with GSK343 + oe-NC. #, p < 0.05, compared with CKD mice treated with GSK343 + oe-EZH2 + oe-NC. All cell experiments were conducted three times independently.
Fig. 5. MST1 polarizes macrophages toward the M2 phenotype and weakens nerve damage induced by hypercalcemia in CKD mice by repressing YAP1. CKD mice were treated with oe-MST1 or combined with oe-YAP1. A, IHC staining of YAP1 protein in the kidney tissue of CKD mice. B, Transfection efficiency of YAP1 overexpression determined by RT-qPCR in TCMK-1 cells. C, Transfection efficiency of YAP1 overexpression determined by immunoblotting in TCMK-1 cells. D, YAP1 and MST1 expression determined by immunoblotting in kidney tissues of CKD mice. E, Body weight of CKD mice from day 0 to 7. F, DAI of CKD mice. G, Levels of Scr and BUN in the serum of CKD mice. H, Blood calcium concentration in CKD mice. I, HE and Masson’s trichrome staining analysis of kidney tissue damage in CKD mice. J, RT-qPCR and immunoblotting of expression of albumin, Kim-1, PAI-1, FN, SMA, and Col. K, Nerve function changes in CKD mice assessed by behavioral tests. L, Immunoblotting of iNOS and Arg1 proteins in the brain tissue of CKD mice. M, Flow cytometry was used to observe CD38-positive (M1-type macrophages) and Egr2-positive (M2-type macrophages) macrophages in the brain tissue of each group of mice. N, Immunofluorescence staining of iNOS- and Arg1-positive macrophages in the brain tissues of CKD mice. O, TUNEL-positive cells in the hippocampal CA1 region of the CKD mice. n = 8 for mice upon each treatment. P, HE staining for pathological changes in rat hippocampus CA1 region and cerebral cortex. n = 8 mice in each treatment. *, p < 0.05, compared with normal mice, TCMK-1 cells transfected with oe-NC or CKD mice treated with oe-NC. #, p < 0.05, compared with CKD mice or those treated with oe-MST1 + oe-NC. All cell experiments were conducted three times independently.
Fig. 6. GSK343 induces M2 polarization of macrophages and delays resultant nerve damage from kidney failure-induced hypercalcemia via the EZH2/MST1/YAP1 axis. CKD mice were treated with GSK343 or combined with oe-YAP1. A, EZH2, MST1 and YAP1 expression determined by RT-qPCR and immunoblotting in the kidney tissue of CKD mice. B, Body weight of CKD mice from day 0 to 7. C, DAI of CKD mice. D, Levels of Scr and BUN in the serum of CKD mice. E, Blood calcium concentration in CKD mice. F, HE staining of the kidney tissue damage of CKD mice. G, RT-qPCR and immunoblotting of expression of albumin, Kim-1, PAI-1, FN, SMA, and Col. H, Nerve function changes in CKD mice. I, Immunoblotting of iNOS and Arg1 proteins in the brain tissue of CKD mice. J, Immunofluorescence staining of iNOS- and Arg1-positive macrophages in the brain tissues of CKD mice. K, Flow cytometry used to observe CD38-positive (M1 macrophages) and Egr2-positive (M2 macrophages) macrophages in the brain tissues of each group of mice. L, TUNEL-positive cells in the hippocampal CA1 region of the CKD mice. M, HE staining analysis of the hippocampal CA1 region and cerebral cortex of CKD mice. n = 8 mice in each treatment. *, p < 0.05, compared with CKD mice treated with GSK343 + oe-NC. All cell experiments were conducted three times independently.
Fig. 7. Schematic diagram of GSK343 affecting the resultant nerve damage from kidney failure-induced hypercalcemia. GSK343 inhibits EZH2 to upregulate MST1 and downregulate YAP1, thereby promoting the M2 polarization of macrophages and reducing resultant nerve damage from kidney failure-induced hypercalcemia.
Supplementary material 2. Supplementary Fig. 2. Representative immunofluorescence images of iNOS and ARG1-positive macrophages in the CA1 region of the hippocampus and TUNEL staining images of apoptosis. A, C, E, and G indicate representative immunofluorescence images of quantitative results in Fig. 2I, 4K, 5M, and 6J, respectively. B, D, F, and H indicate TUNEL staining images of apoptotic cell statistics in Fig. 2K, 4M, 5O, and 6L, respectively.
Discussion
This study has brought forth intriguing findings, substantiating that GSK343, an inhibitor of EZH2, notably mitigates hypercalcemia-induced neurological damage in CKD-affected mice. This mitigation seemingly unfolds through the promotion of M2 macrophage polarization, orchestrated via the EZH2/MST1/YAP1 axis.
It has been previously delineated that the manifestation of M2 macrophage polarization can be indicated by the upregulation of arginase 1 (Arg1), while the concurrent release of inducible nitric oxide synthase (iNOS) heralds the polarization toward the M1 phenotype [23,24]. Present findings indicate that GSK343 notably suppresses iNOS expression, whilst simultaneously elevating Arg1 expression, thereby affirming its capability to propel M2 macrophage polarization. Such polarization has been demonstrated to not only attenuate neuronal damage, especially in the context of spinal cord ischemia-reperfusion injury [25], but also to proffer protective effects against kidney injury [26]. Consequently, GSK343 emerges as a potential candidate for mitigating neuronal damage ensuing from kidney failure-induced hypercalcemia.
Drilling down into the mechanistic depth of GSK343 action, the present investigations illustrate that the role played by this inhibitor in M2 macrophage polarization, and consequently, the amelioration of nerve damage induced by hypercalcemia secondary to kidney failure, is intertwined with the suppressed expression of EZH2 and an elevation in MST1 expression. Previously, GSK343 has been acknowledged as an inhibitor of EZH2 in various cancer subtypes [21]. Protection against acute kidney injury by EZH2 inhibition has been well-documented [27,28]. Moreover, EZH2’s inhibitory action on MST1 expression, via reduction of H3K4me3 mark and RNA polymerase II occupancy on the MST1 promoter C-phosphate-G (CpG) region, has been substantiated [9]. Notably, MST1, whose deficiency is allied with CKD development [29], modulates M2 macrophage polarization by influencing phosphorylation processes [30]. The aforementioned evidence intimates that targeting the GSK343/EZH2/MST1 axis could emerge as a potentially viable strategy in ameliorating nerve damage cascading from kidney failure-induced hypercalcemia.
Moreover, this study uncovered that MST1, through the diminution of YAP1 expression, navigates macrophage polarization toward the M2 phenotype, thereby dampening hypercalcemia-triggered neuronal damage in the milieu of CKD. Aligning with these findings, prior research has documented that MST1 knockdown escalates YAP activity, culminating in renal failure [29]. Additionally, YAP activation amid renal injury can exacerbate CKD progression [31] and impede IL-4/IL-13-induced M2 macrophage polarization in the framework of inflammatory bowel disease [14]. Current experimental data reveal that GSK343 facilitates the polarization of macrophages toward the M2 phenotype, thereby attenuating hypercalcemia-induced nerve damage through the EZH2/MST1/YAP1 axis. While previous studies have illustrated interactions between EZH2 and the C-terminal of YAP [32], the exact mechanism governing their interplay is yet to be unveiled, necessitating further investigative endeavors for comprehensive elucidation.
Conclusions
Our study indicates that GSK343 can prevent nerve damage due to kidney failure-induced hypercalcemia. This prevention was associated with the potentiation of M2 polarization of macrophages, MST1 upregulation, and inhibition of the EZH2/YAP1 axis (Fig. 7). The current findings fill an essential gap in the knowledge of nerve damage due to kidney failure-induced hypercalcemia and provide a vital foundation for future GSK343-based targeted therapy for CKD treatment.
As a cytotoxic heavy metal ion, mercury(II) ion (Hg2+) induces severe oxidative stress and further results in physiological dysfunction. Although mercury poisoning can be treated with many drugs, such as sodium selenite, the therapeutic effect is relatively poor, and it seems that the damage to human health continues. However, the interpretation for the pathogenesis has not been clarified yet. We supposed that the reason is attributed to Hg2+-caused intracellular oxidative stress. To confirm our hypothesis, we strived to design a three-channel ratio fluorescent probe, HCy–SeH, for superoxide anion (O2•–) and Hg2+combined detection. O2•– is a vital precursor for other reactive oxygen species (ROS), which is involved in many physiological and pathological processes. However, until now there is no efficient chemical tool for O2•– and Hg2+ combined detection in cells and in vivo. The fluorescence response of our probe is initiated by a hydrogen abstraction reaction from the hydrocyanine fluorophore moiety. Once oxidized by O2•–, HCy–SeH recovers its π-conjugated system back to a heptamethine cyanine derivative, Cy–SeH. Cy–SeH coexists with its conjugate base, Cy═Se. One emits red fluorescence, and the other one emits green fluorescence. The response unit, −SeH, can trap Hg2+ via a Se–Hg antagonism reaction to afford an orange-emitting final product, Keto–Cy. The probe offers high selectivity and sensitivity toward O2•– and Hg2+. When applied for O2•– and Hg2+detection in HEK 293 cells, the imaging results indicate that our probe can provide a combined response for O2•– and Hg2+ in real time and in situ. Flow cytometry analysis is well-consistent with the results from fluorescence imaging. When applied to image O2•– and Hg2+ in mice models, we find that Hg2+dominantly accumulates in the kidney and induces a burst of O2•–. We confirm that chronic mercurialism can cause severe oxidative damage and renal fibrosis. HCy–SeH further provides a new information that, even when intracellular Hg2+ has been antagonized, the outbreak of O2•– caused by mercury poisoning still lasts.